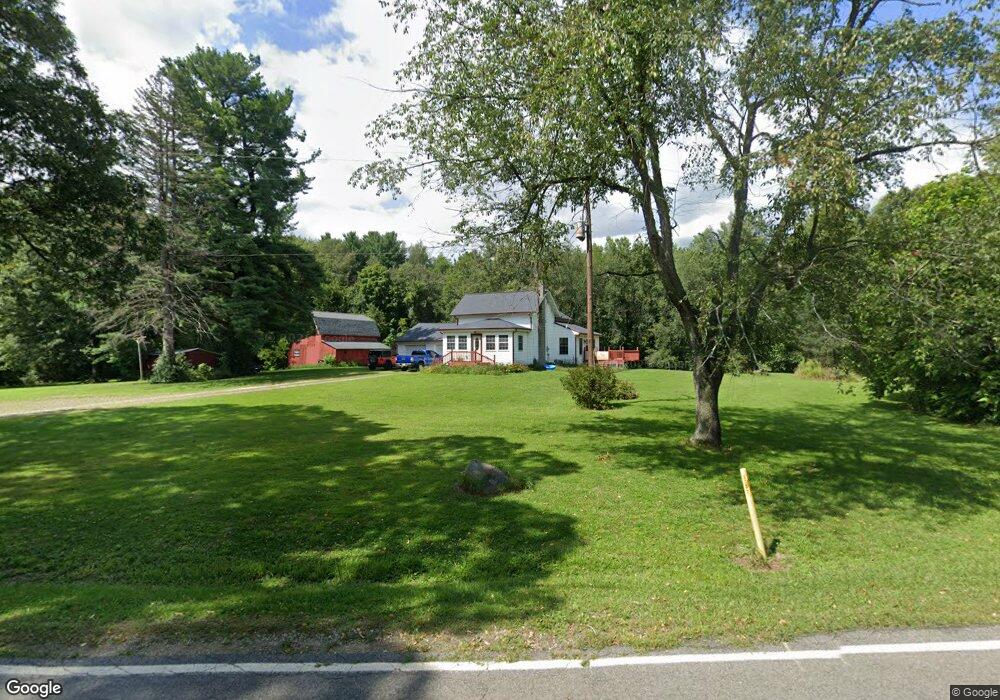
9691 J Dr S Ceresco, MI 49033
Estimated Value: $251,000 - $379,000
3
Beds
1
Bath
1,524
Sq Ft
$217/Sq Ft
Est. Value
About This Home
This home is located at 9691 J Dr S, Ceresco, MI 49033 and is currently estimated at $331,423, approximately $217 per square foot. 9691 J Dr S is a home located in Calhoun County with nearby schools including Harper Creek Middle School and Harper Creek High School.
Ownership History
Date
Name
Owned For
Owner Type
Purchase Details
Closed on
Mar 19, 2012
Sold by
Creech Timothy R and Creech Rosa A
Bought by
Mccaulley Michael Jc and Mccaulley Tammy Sue
Current Estimated Value
Home Financials for this Owner
Home Financials are based on the most recent Mortgage that was taken out on this home.
Original Mortgage
$149,849
Outstanding Balance
$105,976
Interest Rate
4.5%
Mortgage Type
FHA
Estimated Equity
$225,447
Purchase Details
Closed on
Dec 29, 2005
Sold by
Edmonds Bobby J and Edmonds Jody E
Bought by
Creech Timothy R
Home Financials for this Owner
Home Financials are based on the most recent Mortgage that was taken out on this home.
Original Mortgage
$117,800
Interest Rate
6.34%
Mortgage Type
Fannie Mae Freddie Mac
Purchase Details
Closed on
Feb 10, 1994
Sold by
Feltner Edmund P
Bought by
Feltner and Edmonds Jody E
Purchase Details
Closed on
Jul 24, 1987
Sold by
Dunn Donald L
Bought by
Feltner Edmund and Feltner Debra
Create a Home Valuation Report for This Property
The Home Valuation Report is an in-depth analysis detailing your home's value as well as a comparison with similar homes in the area
Home Values in the Area
Average Home Value in this Area
Purchase History
| Date | Buyer | Sale Price | Title Company |
|---|---|---|---|
| Mccaulley Michael Jc | $144,000 | Attorneys Title Agency Llc | |
| Creech Timothy R | $124,000 | Chicago Title Of Michigan | |
| Feltner | -- | -- | |
| Feltner Edmund | -- | -- |
Source: Public Records
Mortgage History
| Date | Status | Borrower | Loan Amount |
|---|---|---|---|
| Open | Mccaulley Michael Jc | $149,849 | |
| Previous Owner | Creech Timothy R | $117,800 |
Source: Public Records
Tax History Compared to Growth
Tax History
| Year | Tax Paid | Tax Assessment Tax Assessment Total Assessment is a certain percentage of the fair market value that is determined by local assessors to be the total taxable value of land and additions on the property. | Land | Improvement |
|---|---|---|---|---|
| 2025 | $3,387 | $132,600 | $0 | $0 |
| 2024 | $2,170 | $111,400 | $0 | $0 |
| 2023 | $2,729 | $103,700 | $0 | $0 |
| 2022 | $2,729 | $92,600 | $0 | $0 |
| 2021 | $2,728 | $88,800 | $0 | $0 |
| 2020 | $2,623 | $80,500 | $0 | $0 |
| 2019 | $0 | $77,300 | $0 | $0 |
| 2018 | $0 | $75,400 | $32,000 | $43,400 |
| 2017 | $0 | $73,200 | $0 | $0 |
| 2016 | $0 | $72,500 | $0 | $0 |
| 2015 | -- | $72,500 | $56,523 | $15,977 |
| 2014 | -- | $74,200 | $56,523 | $17,677 |
Source: Public Records
Map
Nearby Homes
- V/L 10 Mile Rd
- 6703 Oak Grove Rd
- 9304 I Dr S
- 11445 F Dr S
- 10660 D Dr S
- 10047 11 Mile Rd
- 8295 D Dr S
- 3311 8 1 2 Mile Rd
- 11506 11 Mile Rd
- 4850 H Dr S
- 315 E Leroy St
- 325 E Leroy St
- 4600 11 Mile Rd
- 9999 N-Drive S
- 345 E Leroy St
- 8934 5 Mile Rd
- 381 E Leroy St
- 4041 Case Dr
- 11349 6 Mile Rd
- 12293 Beadle Lake Rd
- 6944 Oak Grove Rd
- 7021 10 Mile Rd
- 0 Oak Grove Rd
- 7191 10 Mile Rd
- 6887 Oak Grove Rd
- 7211 10 Mile Rd
- 6814 Oak Grove Rd
- 7250 Oak Grove Rd
- 6848 Oak Grove Rd
- 6738 10 Mile Rd
- 6765 Oak Grove Rd
- 2 J Dr S
- 0 J Dr S
- 7293 Oak Grove Rd
- 0 Oak Grove Rd
- 7333 10 Mile Rd
- 7457 10 Mile Rd
- 7458 10 Mile Rd
- 7354 Oak Grove Rd
- 965 Clark Rd