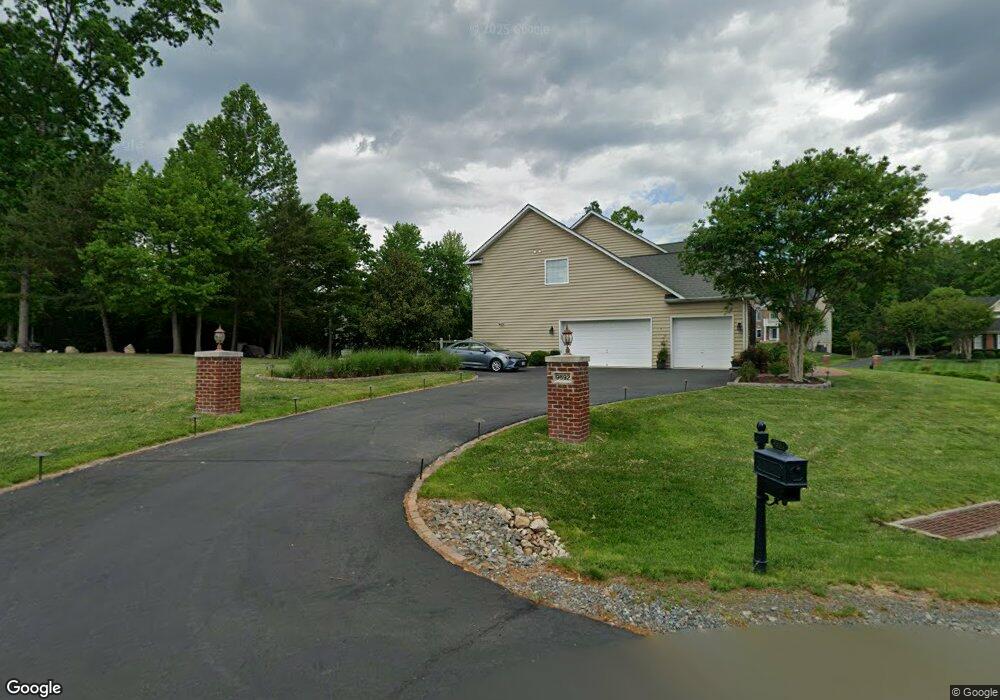
9692 Alexandra Nicole Dr Unit 12 Lorton, VA 22079
Farrs Corner NeighborhoodEstimated Value: $1,317,000 - $1,427,000
5
Beds
6
Baths
4,400
Sq Ft
$314/Sq Ft
Est. Value
About This Home
This home is located at 9692 Alexandra Nicole Dr Unit 12, Lorton, VA 22079 and is currently estimated at $1,381,732, approximately $314 per square foot. 9692 Alexandra Nicole Dr Unit 12 is a home located in Fairfax County with nearby schools including Halley Elementary School, South County Middle School, and South County High School.
Ownership History
Date
Name
Owned For
Owner Type
Purchase Details
Closed on
Jun 8, 2020
Sold by
Craig James M and Craig Adriane B
Bought by
Yusufi David and Mohmand Setareh
Current Estimated Value
Home Financials for this Owner
Home Financials are based on the most recent Mortgage that was taken out on this home.
Original Mortgage
$400,000
Outstanding Balance
$281,197
Interest Rate
3.2%
Mortgage Type
New Conventional
Estimated Equity
$1,100,535
Purchase Details
Closed on
Nov 23, 2009
Sold by
Bbv Building Companies Inc
Bought by
Craig James M
Home Financials for this Owner
Home Financials are based on the most recent Mortgage that was taken out on this home.
Original Mortgage
$812,400
Interest Rate
5.01%
Mortgage Type
Purchase Money Mortgage
Create a Home Valuation Report for This Property
The Home Valuation Report is an in-depth analysis detailing your home's value as well as a comparison with similar homes in the area
Home Values in the Area
Average Home Value in this Area
Purchase History
| Date | Buyer | Sale Price | Title Company |
|---|---|---|---|
| Yusufi David | $940,000 | Old Republic Natl Ttl Ins Co | |
| Craig James M | $790,360 | -- |
Source: Public Records
Mortgage History
| Date | Status | Borrower | Loan Amount |
|---|---|---|---|
| Open | Yusufi David | $400,000 | |
| Previous Owner | Craig James M | $812,400 |
Source: Public Records
Tax History Compared to Growth
Tax History
| Year | Tax Paid | Tax Assessment Tax Assessment Total Assessment is a certain percentage of the fair market value that is determined by local assessors to be the total taxable value of land and additions on the property. | Land | Improvement |
|---|---|---|---|---|
| 2025 | $13,572 | $1,237,940 | $363,000 | $874,940 |
| 2024 | $13,572 | $1,171,550 | $363,000 | $808,550 |
| 2023 | $12,930 | $1,145,740 | $363,000 | $782,740 |
| 2022 | $10,987 | $960,860 | $343,000 | $617,860 |
| 2021 | $10,176 | $867,190 | $338,000 | $529,190 |
| 2020 | $11,423 | $858,870 | $338,000 | $520,870 |
| 2019 | $9,973 | $842,680 | $338,000 | $504,680 |
| 2018 | $10,829 | $941,670 | $341,000 | $600,670 |
| 2017 | $10,291 | $886,370 | $325,000 | $561,370 |
| 2016 | $9,787 | $844,790 | $325,000 | $519,790 |
| 2015 | $9,033 | $809,370 | $319,000 | $490,370 |
| 2014 | $9,098 | $817,050 | $319,000 | $498,050 |
Source: Public Records
Map
Nearby Homes
- 9205 Franks Point Ln
- 9209 Franks Point Ln
- 8834 Ox Rd
- 8811 Ox Rd
- 12001 Skipjack Ct
- 11977 William And Mary Cir
- 12165 Eddystone Ct
- 12221 Seaford Ct
- 10300 Hampton Rd
- 3098 Fennegan Ct
- 8625 Oak Chase Cir
- 9712 Thorn Bush Dr
- 1981 Penfold Ct
- 10400 Hampton Rd
- 8153 Old Barrington Blvd
- 12075 Willowood Dr
- 1952 Mariner Ln
- 11498 Corinthia Ct Unit 80
- 12060 Willowood Dr
- 2094 Pilgrim Dr
- 9058 John Sutherland Ln
- 9000 John Sutherland Ln
- 9056 John Sutherland Ln
- 9056 John Sutherland Ln Unit LOT 13
- 1005 John Sutherland Ln
- 1006 John Sutherland Dr
- 1002 John Sutherland Dr
- 1000 John Sutherland Dr
- 1001 John Sutherland Ln Unit LOT 20
- 1005 John Sutherland Ln Unit LOT 14
- 1000 John Sutherland Dr Unit LOT 26
- 1002 John Sutherland Dr Unit LOT 25
- 1006 John Sutherland Dr Unit LOT 30
- 1001 John Sutherland Ln
- 9691 Alexandra Nicole Dr
- 9059 John Sutherland Ln
- 9054 John Sutherland Ln
- 9057 John Sutherland Ln
- 9694 Alexandra Nicole Dr
- 9694 Alexandra Nicole Dr Unit LOT 11