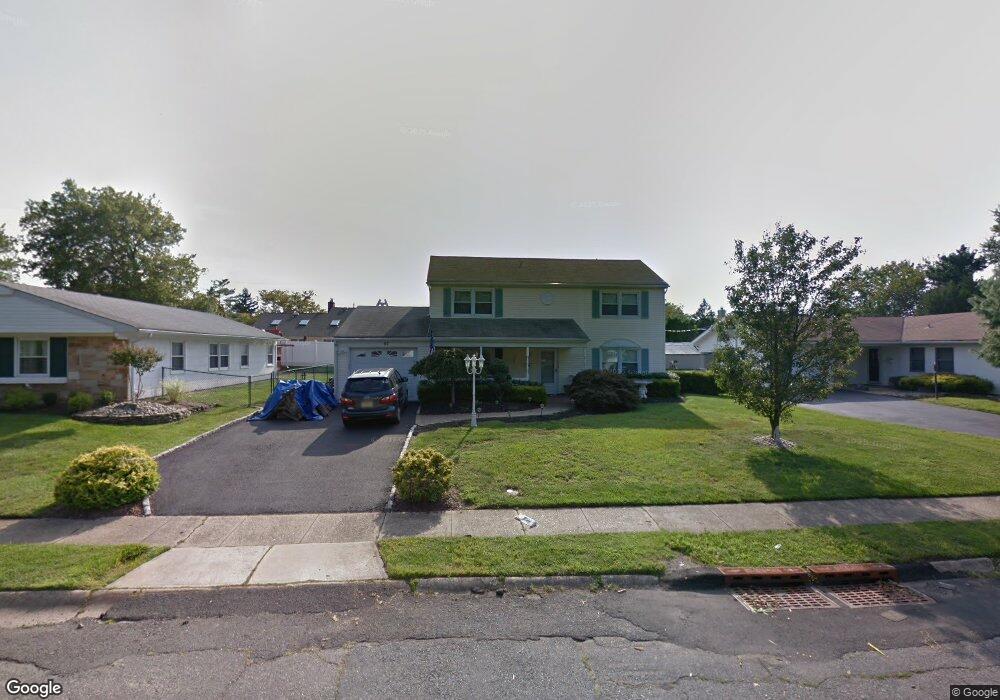
97 Andover Ln Matawan, NJ 07747
Estimated Value: $671,000 - $683,000
3
Beds
3
Baths
1,788
Sq Ft
$379/Sq Ft
Est. Value
About This Home
This home is located at 97 Andover Ln, Matawan, NJ 07747 and is currently estimated at $676,852, approximately $378 per square foot. 97 Andover Ln is a home located in Monmouth County with nearby schools including Matawan Reg High School, St Benedict School, and St. Joseph Elementary School.
Ownership History
Date
Name
Owned For
Owner Type
Purchase Details
Closed on
Feb 18, 2003
Sold by
Wilner Robert
Bought by
Emma Michael and Emma Cindy
Current Estimated Value
Home Financials for this Owner
Home Financials are based on the most recent Mortgage that was taken out on this home.
Original Mortgage
$262,400
Outstanding Balance
$112,625
Interest Rate
5.98%
Estimated Equity
$564,227
Purchase Details
Closed on
Sep 26, 1994
Sold by
Shore Herbert
Bought by
Wilner Robert and Wilner Lisa
Home Financials for this Owner
Home Financials are based on the most recent Mortgage that was taken out on this home.
Original Mortgage
$147,000
Interest Rate
8.5%
Create a Home Valuation Report for This Property
The Home Valuation Report is an in-depth analysis detailing your home's value as well as a comparison with similar homes in the area
Home Values in the Area
Average Home Value in this Area
Purchase History
| Date | Buyer | Sale Price | Title Company |
|---|---|---|---|
| Emma Michael | $328,000 | -- | |
| Wilner Robert | $163,000 | -- |
Source: Public Records
Mortgage History
| Date | Status | Borrower | Loan Amount |
|---|---|---|---|
| Open | Emma Michael | $262,400 | |
| Previous Owner | Wilner Robert | $147,000 |
Source: Public Records
Tax History Compared to Growth
Tax History
| Year | Tax Paid | Tax Assessment Tax Assessment Total Assessment is a certain percentage of the fair market value that is determined by local assessors to be the total taxable value of land and additions on the property. | Land | Improvement |
|---|---|---|---|---|
| 2025 | $11,188 | $622,600 | $407,300 | $215,300 |
| 2024 | $10,748 | $553,600 | $342,200 | $211,400 |
| 2023 | $10,748 | $502,500 | $296,100 | $206,400 |
| 2022 | $10,307 | $425,700 | $229,200 | $196,500 |
| 2021 | $10,307 | $381,300 | $206,500 | $174,800 |
| 2020 | $10,500 | $386,900 | $216,000 | $170,900 |
| 2019 | $10,410 | $372,600 | $202,700 | $169,900 |
| 2018 | $9,941 | $356,700 | $194,700 | $162,000 |
| 2017 | $9,536 | $347,000 | $175,700 | $171,300 |
| 2016 | $8,873 | $337,000 | $170,000 | $167,000 |
| 2015 | $9,307 | $339,300 | $176,600 | $162,700 |
| 2014 | $8,869 | $329,700 | $168,100 | $161,600 |
Source: Public Records
Map
Nearby Homes