
Landlord's Agent in 2022
Zachary Hall
Dependable Real Estate, Inc
(617) 553-4717
2 Total Sales
Estimated Value: $402,000 - $717,000
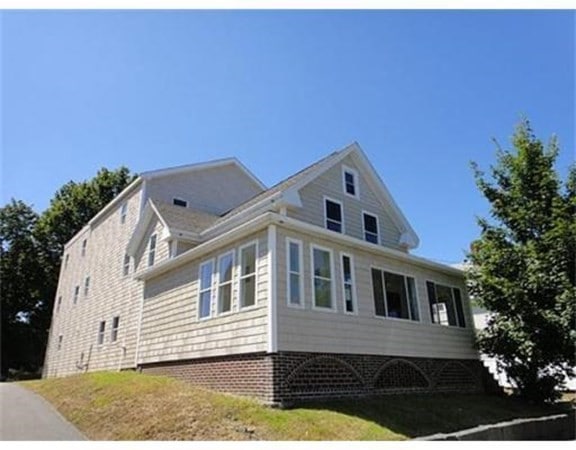
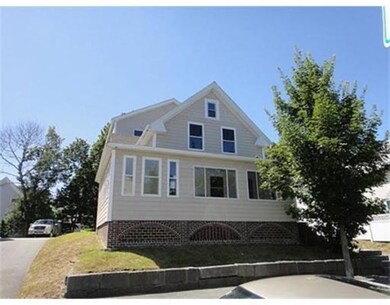
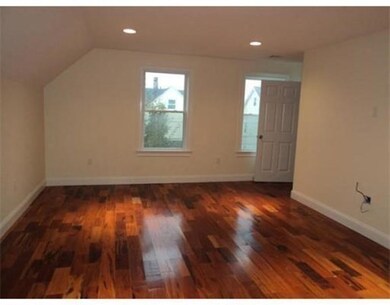
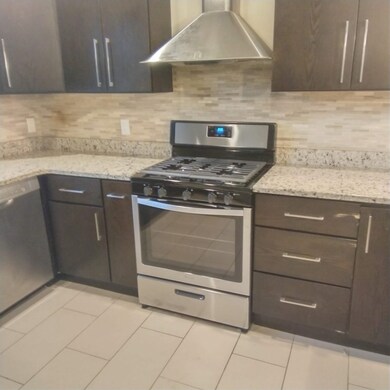
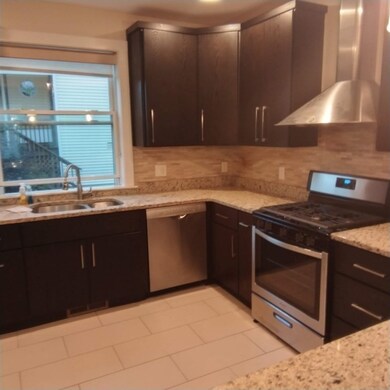
This home is located at 97 Edwards St Unit 1, Quincy, MA 02169 since 03 September 2022 and is currently priced at $520,423. This property was built in 1880. 97 Edwards St Unit 1 is a home located in Norfolk County with nearby schools including Point Webster Middle School, Clifford H. Marshall Elementary School, and Quincy High School.
| Date | Buyer | Sale Price | Title Company |
|---|---|---|---|
| Po Raymond C | $345,000 | -- |
| Date | Status | Borrower | Loan Amount |
|---|---|---|---|
| Open | Po Raymond C | $276,000 |
| Date | Event | Price | List to Sale | Price per Sq Ft | Prior Sale |
|---|---|---|---|---|---|
| 10/11/2022 10/11/22 | Rented | $3,300 | 0.0% | -- | |
| 09/22/2022 09/22/22 | Price Changed | $3,300 | -5.7% | $2 / Sq Ft | |
| 09/03/2022 09/03/22 | For Rent | $3,500 | 0.0% | -- | |
| 05/08/2012 05/08/12 | Sold | $345,000 | -1.4% | $223 / Sq Ft | View Prior Sale |
| 01/30/2012 01/30/12 | Pending | -- | -- | -- | |
| 10/18/2011 10/18/11 | For Sale | $349,900 | -- | $226 / Sq Ft |
| Year | Tax Paid | Tax Assessment Tax Assessment Total Assessment is a certain percentage of the fair market value that is determined by local assessors to be the total taxable value of land and additions on the property. | Land | Improvement |
|---|---|---|---|---|
| 2025 | $5,385 | $467,000 | $0 | $467,000 |
| 2024 | $5,030 | $446,300 | $0 | $446,300 |
| 2023 | $4,656 | $418,300 | $0 | $418,300 |
| 2022 | $4,676 | $390,300 | $0 | $390,300 |
| 2021 | $4,722 | $389,000 | $0 | $389,000 |
| 2020 | $4,685 | $376,900 | $0 | $376,900 |
| 2019 | $4,546 | $362,200 | $0 | $362,200 |
| 2018 | $4,488 | $336,400 | $0 | $336,400 |
| 2017 | $4,489 | $316,800 | $0 | $316,800 |
| 2016 | $4,319 | $300,800 | $0 | $300,800 |
| 2015 | $4,303 | $294,700 | $0 | $294,700 |
| 2014 | $4,048 | $272,400 | $0 | $272,400 |
Landlord's Agent in 2022
Zachary Hall
Dependable Real Estate, Inc
(617) 553-4717
2 Total Sales
Seller's Agent in 2012
Ellen Corbett
Hillman Homes
(617) 699-0892
12 Total Sales
A
Buyer's Agent in 2012
Anthony Schepis
Mariner Realty, LLC
Source: MLS Property Information Network (MLS PIN)
MLS Number: 73031994
APN: QUIN-002041-000020-000001
Disclaimer: Certain information contained herein is derived from information provided by parties other than Homes.com. All information provided is deemed reliable, but is not guaranteed to be accurate and should be independently verified.
![]() The property listing data and information, or the Images, set forth herein were provided to MLS Property Information Network, Inc. from third party sources, including sellers, lessors and public records, and were compiled by MLS Property Information Network, Inc. The property listing data and information, and the Images, are for the personal, non-commercial use of consumers having a good faith interest in purchasing or leasing listed properties of the type displayed to them and may not be used for any purpose other than to identify prospective properties which such consumers may have a good faith interest in purchasing or leasing. MLS Property Information Network, Inc. and its subscribers disclaim any and all representations and warranties as to the accuracy of the property listing data and information, or as to the accuracy of any of the Images, set forth herein.
The property listing data and information, or the Images, set forth herein were provided to MLS Property Information Network, Inc. from third party sources, including sellers, lessors and public records, and were compiled by MLS Property Information Network, Inc. The property listing data and information, and the Images, are for the personal, non-commercial use of consumers having a good faith interest in purchasing or leasing listed properties of the type displayed to them and may not be used for any purpose other than to identify prospective properties which such consumers may have a good faith interest in purchasing or leasing. MLS Property Information Network, Inc. and its subscribers disclaim any and all representations and warranties as to the accuracy of the property listing data and information, or as to the accuracy of any of the Images, set forth herein.