Estimated Value: $131,152 - $192,000
Studio
--
Bath
2,000
Sq Ft
$77/Sq Ft
Est. Value
About This Home
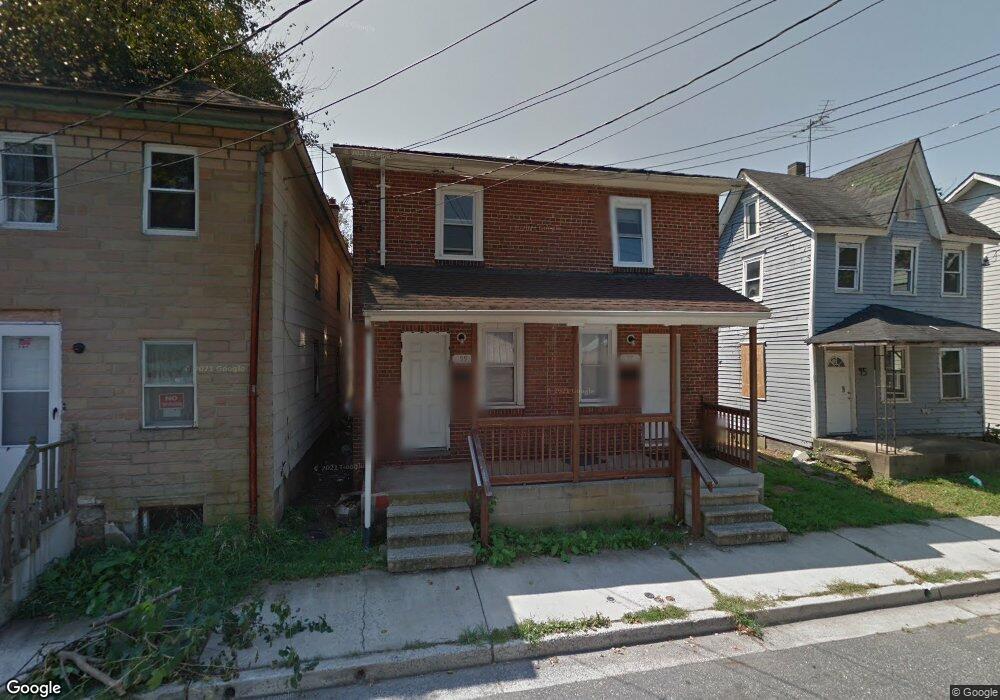
This home is located at 97 Hedge St Unit 99, Salem, NJ 08079 and is currently estimated at $154,538, approximately $77 per square foot. 97 Hedge St Unit 99 is a home located in Salem County with nearby schools including John Fenwick Elementary School, Salem Middle School, and Salem High School.
Ownership History
Date
Name
Owned For
Owner Type
Purchase Details
Closed on
Aug 5, 2022
Sold by
Rampart Properties Llc
Bought by
Brown Thomas
Current Estimated Value
Home Financials for this Owner
Home Financials are based on the most recent Mortgage that was taken out on this home.
Original Mortgage
$63,750
Interest Rate
5.13%
Mortgage Type
New Conventional
Purchase Details
Closed on
Jul 25, 2022
Sold by
Rampart Properties Llc
Bought by
Dlw Realty Properties Llc
Home Financials for this Owner
Home Financials are based on the most recent Mortgage that was taken out on this home.
Original Mortgage
$63,750
Interest Rate
5.13%
Mortgage Type
New Conventional
Purchase Details
Closed on
Feb 28, 2020
Sold by
Urban Carl
Bought by
Rampart Properties Llc
Purchase Details
Closed on
Aug 25, 2015
Sold by
Bk Re Llc
Bought by
Urban Carl
Purchase Details
Closed on
May 1, 2012
Sold by
Top Shelf Investments Llc
Bought by
Top Shelf Investments Llc and Bk Re Llc
Purchase Details
Closed on
Oct 5, 2005
Sold by
Bleiman Jack
Bought by
Weaver Anthony and Weaver Resie
Home Financials for this Owner
Home Financials are based on the most recent Mortgage that was taken out on this home.
Original Mortgage
$75,600
Interest Rate
8.5%
Mortgage Type
Fannie Mae Freddie Mac
Purchase Details
Closed on
Aug 5, 2005
Sold by
Bleiman Jack
Bought by
Bleiman Jack
Purchase Details
Closed on
Apr 26, 2002
Sold by
Rainey Mary V
Bought by
Bleiman Jack
Create a Home Valuation Report for This Property
The Home Valuation Report is an in-depth analysis detailing your home's value as well as a comparison with similar homes in the area
Home Values in the Area
Average Home Value in this Area
Purchase History
| Date | Buyer | Sale Price | Title Company |
|---|---|---|---|
| Brown Thomas | $85,000 | Stewart Title Guaranty Company | |
| Dlw Realty Properties Llc | $85,000 | Chiacchio Thomas H | |
| Rampart Properties Llc | $40,000 | Core Title | |
| Urban Carl | $105,000 | Salem Oak Title Agency Inc | |
| Top Shelf Investments Llc | $143,136 | Surety Title Corp | |
| Weaver Anthony | $84,000 | Heritage Title & Abstract Ag | |
| Bleiman Jack | -- | -- | |
| Bleiman Jack | $25,000 | -- |
Source: Public Records
Mortgage History
| Date | Status | Borrower | Loan Amount |
|---|---|---|---|
| Previous Owner | Brown Thomas | $63,750 | |
| Previous Owner | Dlw Realty Properties Llc | $65,000 | |
| Previous Owner | Weaver Anthony | $75,600 |
Source: Public Records
Tax History
| Year | Tax Paid | Tax Assessment Tax Assessment Total Assessment is a certain percentage of the fair market value that is determined by local assessors to be the total taxable value of land and additions on the property. | Land | Improvement |
|---|---|---|---|---|
| 2025 | $4,382 | $53,300 | $7,600 | $45,700 |
| 2024 | $4,190 | $53,300 | $7,600 | $45,700 |
| 2023 | $4,190 | $53,300 | $7,600 | $45,700 |
| 2022 | $4,007 | $53,300 | $7,600 | $45,700 |
| 2021 | $3,869 | $53,300 | $7,600 | $45,700 |
| 2020 | $3,791 | $53,300 | $7,600 | $45,700 |
| 2019 | $3,768 | $53,300 | $7,600 | $45,700 |
| 2018 | $3,685 | $53,300 | $7,600 | $45,700 |
| 2017 | $3,640 | $53,300 | $7,600 | $45,700 |
| 2016 | $2,741 | $70,000 | $15,700 | $54,300 |
| 2015 | $3,406 | $88,100 | $15,700 | $72,400 |
| 2014 | $3,388 | $88,100 | $15,700 | $72,400 |
Source: Public Records
Map
Nearby Homes
- 95 Hedge St
- 69 Carpenter St
- 75 Hedge St Unit 2 RR
- 120 Thompson St
- 12 Oak St
- 176 Griffith St
- 4 Belden St
- 183 E Broadway Unit C-8
- 183 E Broadway Unit C-27
- 196 198 E Broadway
- 59 Market St
- 6 Walnut St
- 55 Market St
- 79 Walnut St
- 210 Wesley St
- 12 Church St
- 179 Victory Ave
- 187 7th St
- 78 Walnut St
- 197 Pine Ave
Your Personal Tour Guide
Ask me questions while you tour the home.