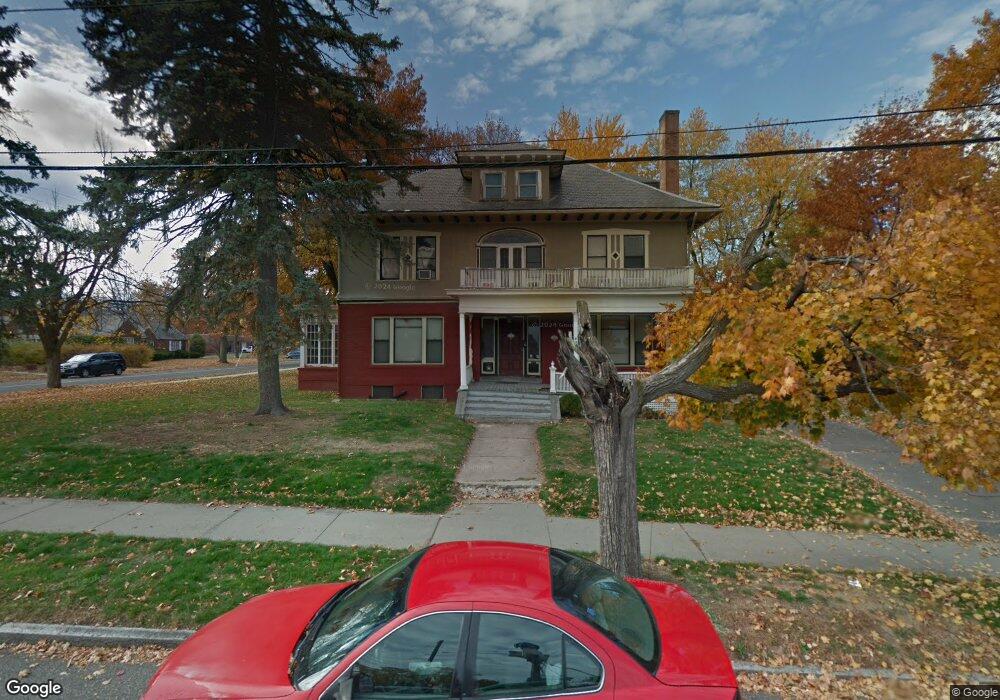
97 Locust St Holyoke, MA 01040
Estimated Value: $296,000 - $324,145
7
Beds
3
Baths
4,830
Sq Ft
$64/Sq Ft
Est. Value
About This Home
This home is located at 97 Locust St, Holyoke, MA 01040 and is currently estimated at $308,536, approximately $63 per square foot. 97 Locust St is a home located in Hampden County with nearby schools including H.B. Lawrence Elementary School, Holyoke High School, and Mater Dolorosa Elementary School.
Ownership History
Date
Name
Owned For
Owner Type
Purchase Details
Closed on
Nov 24, 2025
Sold by
Williams Kenrick D and Jiggetts Lelia
Bought by
Williams Kenrick D
Current Estimated Value
Home Financials for this Owner
Home Financials are based on the most recent Mortgage that was taken out on this home.
Original Mortgage
$46,978
Outstanding Balance
$46,933
Interest Rate
6.17%
Mortgage Type
Purchase Money Mortgage
Estimated Equity
$261,603
Purchase Details
Closed on
Aug 17, 2006
Sold by
Williams Kenrick D
Bought by
Williams Kenrick D and Jiggetts Lelia
Home Financials for this Owner
Home Financials are based on the most recent Mortgage that was taken out on this home.
Original Mortgage
$152,000
Interest Rate
6.88%
Mortgage Type
Purchase Money Mortgage
Purchase Details
Closed on
Jul 1, 2002
Sold by
Drapeau Ernest J
Bought by
Williams Kenrick D
Home Financials for this Owner
Home Financials are based on the most recent Mortgage that was taken out on this home.
Original Mortgage
$104,000
Interest Rate
6.92%
Mortgage Type
Purchase Money Mortgage
Create a Home Valuation Report for This Property
The Home Valuation Report is an in-depth analysis detailing your home's value as well as a comparison with similar homes in the area
Home Values in the Area
Average Home Value in this Area
Purchase History
| Date | Buyer | Sale Price | Title Company |
|---|---|---|---|
| Williams Kenrick D | -- | -- | |
| Williams Kenrick D | -- | -- | |
| Williams Kenrick D | -- | -- | |
| Williams Kenrick D | $130,000 | -- |
Source: Public Records
Mortgage History
| Date | Status | Borrower | Loan Amount |
|---|---|---|---|
| Open | Williams Kenrick D | $46,978 | |
| Previous Owner | Williams Kenrick D | $152,000 | |
| Previous Owner | Williams Kenrick D | $104,000 |
Source: Public Records
Tax History
| Year | Tax Paid | Tax Assessment Tax Assessment Total Assessment is a certain percentage of the fair market value that is determined by local assessors to be the total taxable value of land and additions on the property. | Land | Improvement |
|---|---|---|---|---|
| 2025 | $2,209 | $126,500 | $27,200 | $99,300 |
| 2024 | $2,397 | $126,500 | $27,200 | $99,300 |
| 2023 | $2,373 | $126,500 | $27,200 | $99,300 |
| 2022 | $2,436 | $126,500 | $27,200 | $99,300 |
| 2021 | $2,438 | $126,500 | $27,200 | $99,300 |
| 2020 | $2,414 | $126,500 | $27,200 | $99,300 |
| 2019 | $2,440 | $126,500 | $27,200 | $99,300 |
| 2018 | $2,420 | $126,500 | $27,200 | $99,300 |
| 2017 | $2,425 | $126,500 | $27,200 | $99,300 |
| 2016 | $2,419 | $126,500 | $27,200 | $99,300 |
| 2015 | $2,409 | $126,500 | $27,200 | $99,300 |
Source: Public Records
Map
Nearby Homes
- 77 Locust St
- 225-227 Beech St
- 301-303 Linden St
- 1137 Dwight St Unit C
- 15-17 Oconnor Ave
- 219 Suffolk St
- 215 Elm St
- 193 Elm St
- 1022-1024 Hampden St
- 192 Chestnut St
- 15 Chapman Ave
- 391 Pleasant St
- 1705-1707 Northampton St
- 1225 Hampden St
- 11 Hampshire St
- 352 Pleasant St
- 151 Lincoln St
- 21 Francis Ave
- 76 Nonotuck St
- 68 Fairfield Ave
Your Personal Tour Guide
Ask me questions while you tour the home.