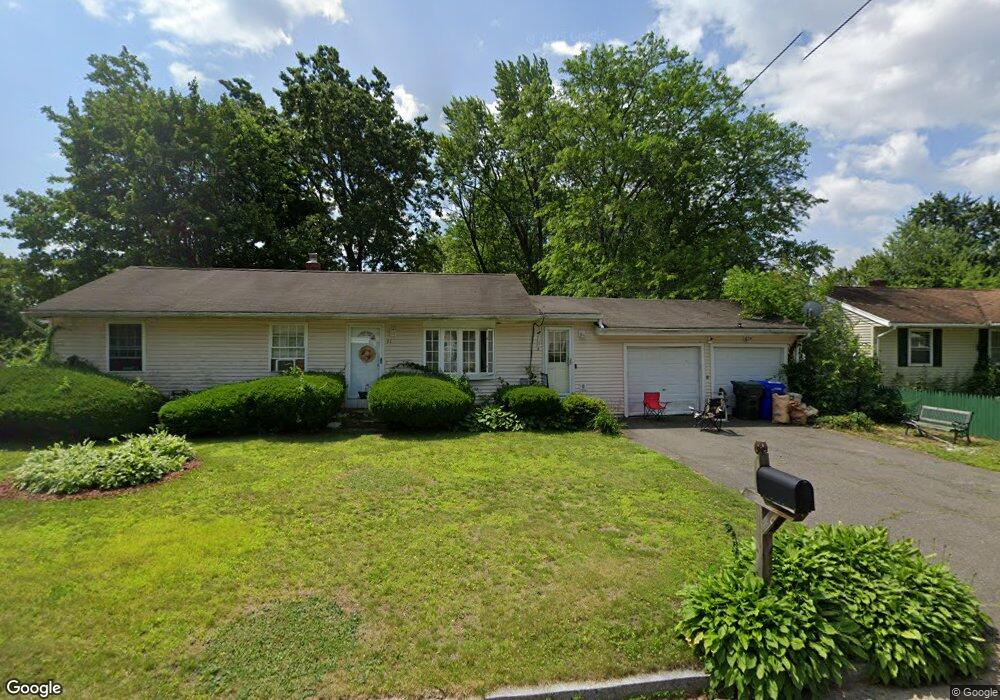
97 Navajo Rd Springfield, MA 01109
Sixteen Acres NeighborhoodEstimated Value: $273,000 - $351,000
3
Beds
2
Baths
1,728
Sq Ft
$177/Sq Ft
Est. Value
About This Home
This home is located at 97 Navajo Rd, Springfield, MA 01109 and is currently estimated at $306,359, approximately $177 per square foot. 97 Navajo Rd is a home located in Hampden County with nearby schools including Frank H. Freedman School, John J Duggan Middle, and Springfield High School of Science and Technology.
Ownership History
Date
Name
Owned For
Owner Type
Purchase Details
Closed on
Apr 20, 2017
Sold by
Straughn Naomi B
Bought by
Straughn Naomi B and Straughn Dante J
Current Estimated Value
Purchase Details
Closed on
Jan 14, 1997
Sold by
Wilshire Credit Corp
Bought by
Hobbs Esta
Home Financials for this Owner
Home Financials are based on the most recent Mortgage that was taken out on this home.
Original Mortgage
$76,500
Interest Rate
7.46%
Mortgage Type
Purchase Money Mortgage
Create a Home Valuation Report for This Property
The Home Valuation Report is an in-depth analysis detailing your home's value as well as a comparison with similar homes in the area
Home Values in the Area
Average Home Value in this Area
Purchase History
| Date | Buyer | Sale Price | Title Company |
|---|---|---|---|
| Straughn Naomi B | -- | -- | |
| Hobbs Esta | $60,000 | -- |
Source: Public Records
Mortgage History
| Date | Status | Borrower | Loan Amount |
|---|---|---|---|
| Previous Owner | Hobbs Esta | $102,600 | |
| Previous Owner | Hobbs Esta | $76,500 | |
| Previous Owner | Hobbs Esta | $64,250 | |
| Previous Owner | Hobbs Esta | $54,502 |
Source: Public Records
Tax History
| Year | Tax Paid | Tax Assessment Tax Assessment Total Assessment is a certain percentage of the fair market value that is determined by local assessors to be the total taxable value of land and additions on the property. | Land | Improvement |
|---|---|---|---|---|
| 2025 | $4,274 | $272,600 | $51,700 | $220,900 |
| 2024 | $4,264 | $265,500 | $51,700 | $213,800 |
| 2023 | $4,395 | $257,800 | $49,200 | $208,600 |
| 2022 | $3,760 | $199,800 | $49,200 | $150,600 |
| 2021 | $3,648 | $193,000 | $44,700 | $148,300 |
| 2020 | $3,642 | $186,500 | $44,700 | $141,800 |
| 2019 | $3,184 | $161,800 | $44,700 | $117,100 |
| 2018 | $3,255 | $165,400 | $44,700 | $120,700 |
| 2017 | $3,089 | $157,100 | $49,600 | $107,500 |
| 2016 | $2,864 | $145,700 | $49,600 | $96,100 |
| 2015 | $2,811 | $142,900 | $49,600 | $93,300 |
Source: Public Records
Map
Nearby Homes
- 30 W Hill Rd
- 55 Old Farm Rd
- 37 Chesterfield Ave
- 384 Abbott St
- 54 S Shore Dr
- 74 Valley Rd
- 73 Timber Ln
- 231 Dayton St
- 101 Regal St
- 944 Wilbraham Rd
- 63 Lawton St
- 120 Bridle Path Rd
- 236 Pondview Dr
- 7 Ashbrook St
- 18 Riverton Rd
- 55 Allen St
- 8 Putnam St
- 81 W Crystal Brook Dr
- 108 Birchland Ave
- 86 Wildwood Ave
Your Personal Tour Guide
Ask me questions while you tour the home.