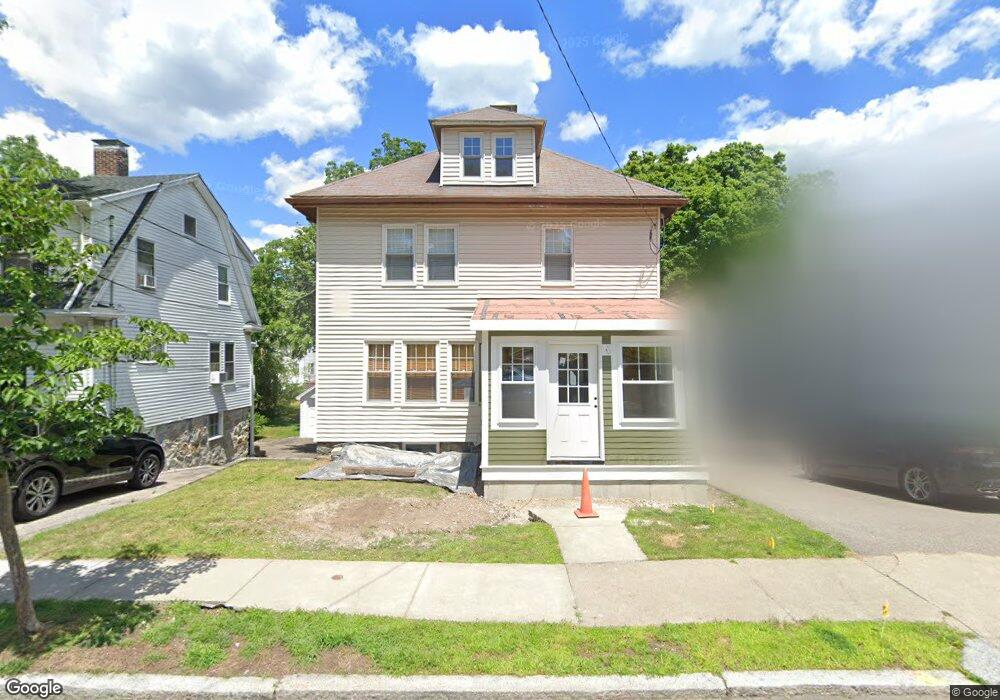
97 Perham St West Roxbury, MA 02132
West Roxbury NeighborhoodEstimated Value: $775,000 - $880,000
2
Beds
2
Baths
1,352
Sq Ft
$624/Sq Ft
Est. Value
About This Home
This home is located at 97 Perham St, West Roxbury, MA 02132 and is currently estimated at $843,138, approximately $623 per square foot. 97 Perham St is a home located in Suffolk County with nearby schools including St Theresa School, Holy Name Parish School, and Catholic Memorial School.
Ownership History
Date
Name
Owned For
Owner Type
Purchase Details
Closed on
May 16, 2003
Sold by
English Ft
Bought by
Mccaron Paul F
Current Estimated Value
Home Financials for this Owner
Home Financials are based on the most recent Mortgage that was taken out on this home.
Original Mortgage
$279,200
Interest Rate
5.84%
Mortgage Type
Purchase Money Mortgage
Create a Home Valuation Report for This Property
The Home Valuation Report is an in-depth analysis detailing your home's value as well as a comparison with similar homes in the area
Home Values in the Area
Average Home Value in this Area
Purchase History
| Date | Buyer | Sale Price | Title Company |
|---|---|---|---|
| Mccaron Paul F | $349,000 | -- |
Source: Public Records
Mortgage History
| Date | Status | Borrower | Loan Amount |
|---|---|---|---|
| Open | Mccaron Paul F | $240,450 | |
| Closed | Mccaron Paul F | $279,200 |
Source: Public Records
Tax History
| Year | Tax Paid | Tax Assessment Tax Assessment Total Assessment is a certain percentage of the fair market value that is determined by local assessors to be the total taxable value of land and additions on the property. | Land | Improvement |
|---|---|---|---|---|
| 2025 | $9,269 | $800,400 | $238,100 | $562,300 |
| 2024 | $8,239 | $755,900 | $250,300 | $505,600 |
| 2023 | $7,402 | $689,200 | $238,400 | $450,800 |
| 2022 | $6,817 | $626,600 | $216,800 | $409,800 |
| 2021 | $6,380 | $597,900 | $212,500 | $385,400 |
| 2020 | $5,841 | $553,100 | $190,200 | $362,900 |
| 2019 | $5,556 | $527,100 | $171,100 | $356,000 |
| 2018 | $5,115 | $488,100 | $171,100 | $317,000 |
| 2017 | $5,065 | $478,300 | $171,100 | $307,200 |
| 2016 | $5,108 | $464,400 | $171,100 | $293,300 |
| 2015 | $5,102 | $421,300 | $166,700 | $254,600 |
| 2014 | $4,999 | $397,400 | $166,700 | $230,700 |
Source: Public Records
Map
Nearby Homes
- 73 Dent St Unit 1
- 183 Temple St
- 340 Baker St Unit 1
- 425 Lagrange St Unit 203
- 1216 Vfw Pkwy Unit 40
- 20 Powell St
- 348 Lagrange St
- 37 Hastings St Unit 201
- 37 Hastings St Unit 103
- 116 Spring St Unit D2
- 1214 Vfw Pkwy Unit 30
- 17 Cass St Unit 4
- 577 Baker St Unit 577
- 2231 Centre St
- 12 Bronx Rd
- 78 Howitt Rd
- 72 Redlands Rd
- 231 Lagrange St
- 55 Redlands Rd
- 72-74 Manthorne Rd Unit 74