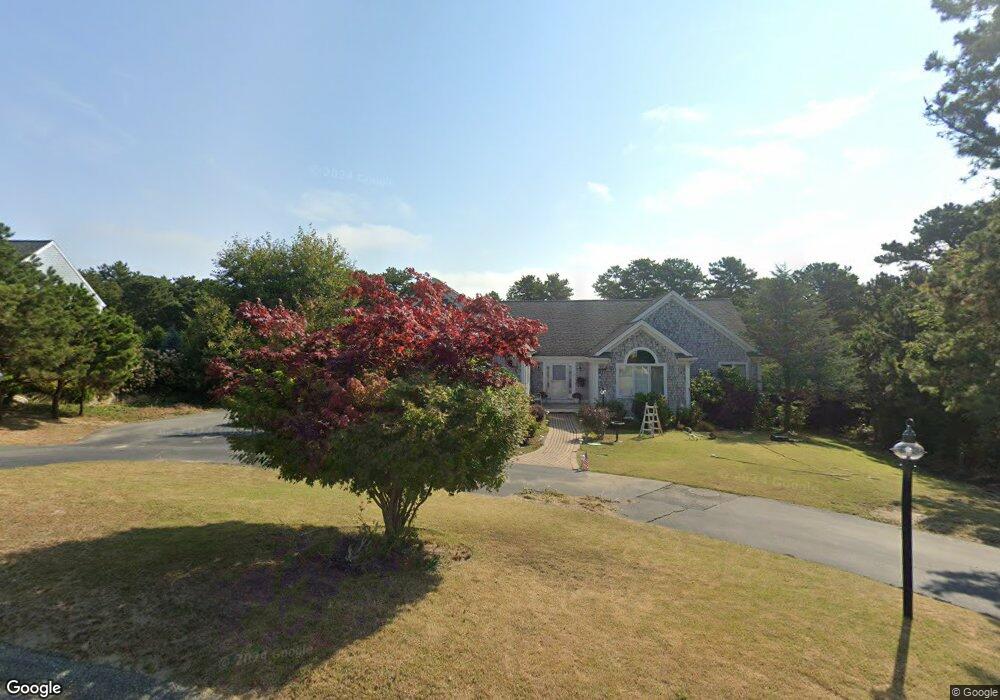
97 Polaris Dr Mashpee, MA 02649
Estimated Value: $1,002,000 - $1,546,316
3
Beds
4
Baths
2,412
Sq Ft
$498/Sq Ft
Est. Value
About This Home
This home is located at 97 Polaris Dr, Mashpee, MA 02649 and is currently estimated at $1,200,079, approximately $497 per square foot. 97 Polaris Dr is a home located in Barnstable County with nearby schools including Kenneth C. Coombs School, Quashnet School, and Mashpee Middle School.
Ownership History
Date
Name
Owned For
Owner Type
Purchase Details
Closed on
Apr 27, 2023
Sold by
Byrnes Melissa L
Bought by
Byrnes Melissa and Russell Hunter
Current Estimated Value
Home Financials for this Owner
Home Financials are based on the most recent Mortgage that was taken out on this home.
Original Mortgage
$260,000
Outstanding Balance
$252,678
Interest Rate
6.32%
Mortgage Type
Commercial
Estimated Equity
$947,401
Purchase Details
Closed on
Mar 31, 2010
Sold by
Uldis Ozolins T and Ozolins Uldis
Bought by
Byrnes Melissa L
Purchase Details
Closed on
Sep 27, 2007
Sold by
Ozolins Uldis
Bought by
Uldis Ozolins T and Ozolins Uldis
Purchase Details
Closed on
Nov 19, 2003
Sold by
Weinstein Builders Inc
Bought by
Ozolins Uldis
Create a Home Valuation Report for This Property
The Home Valuation Report is an in-depth analysis detailing your home's value as well as a comparison with similar homes in the area
Home Values in the Area
Average Home Value in this Area
Purchase History
| Date | Buyer | Sale Price | Title Company |
|---|---|---|---|
| Byrnes Melissa | -- | None Available | |
| Byrnes Melissa | -- | None Available | |
| Byrnes Melissa L | $560,000 | -- | |
| Uldis Ozolins T | -- | -- | |
| Ozolins Uldis | $590,700 | -- | |
| Byrnes Melissa L | $560,000 | -- | |
| Uldis Ozolins T | -- | -- | |
| Ozolins Uldis | $590,700 | -- |
Source: Public Records
Mortgage History
| Date | Status | Borrower | Loan Amount |
|---|---|---|---|
| Open | Byrnes Melissa | $260,000 | |
| Closed | Byrnes Melissa | $260,000 | |
| Previous Owner | Ozolins Uldis | $938,250 | |
| Previous Owner | Ozolins Uldis | $472,000 |
Source: Public Records
Tax History Compared to Growth
Tax History
| Year | Tax Paid | Tax Assessment Tax Assessment Total Assessment is a certain percentage of the fair market value that is determined by local assessors to be the total taxable value of land and additions on the property. | Land | Improvement |
|---|---|---|---|---|
| 2025 | $7,313 | $1,104,700 | $244,200 | $860,500 |
| 2024 | $6,881 | $1,070,200 | $240,600 | $829,600 |
| 2023 | $6,404 | $913,500 | $229,100 | $684,400 |
| 2022 | $6,282 | $768,900 | $200,600 | $568,300 |
| 2021 | $6,232 | $687,100 | $187,100 | $500,000 |
| 2020 | $6,740 | $667,400 | $180,000 | $487,400 |
| 2019 | $5,347 | $638,600 | $180,000 | $458,600 |
| 2018 | $4,883 | $629,600 | $180,000 | $449,600 |
| 2017 | $4,736 | $589,300 | $180,000 | $409,300 |
| 2016 | $5,222 | $565,100 | $180,000 | $385,100 |
| 2015 | $5,003 | $549,200 | $180,000 | $369,200 |
| 2014 | $5,118 | $545,000 | $177,100 | $367,900 |
Source: Public Records
Map
Nearby Homes
- 10 Shadbush Cir
- 8 Shadbush Cir
- 109 Great Pines Dr
- 7 Sandy Way
- 20 Sandy Way
- 41 Great Pines Dr
- 17 Degrass Rd
- 89 Degrass Rd
- 247 Great Pines Dr
- 55 Blue Castle Dr
- 61 Wintergreen Rd
- 29 Carl Landi Cir
- 240 Surf Dr
- 6 Heron Way
- 84 Overlook Cir
- 1 Beech Plum Dr
- 22 & 26 Oyster Way
- 26 Oyster Way
- 9 North Way
- 22 Oyster Way