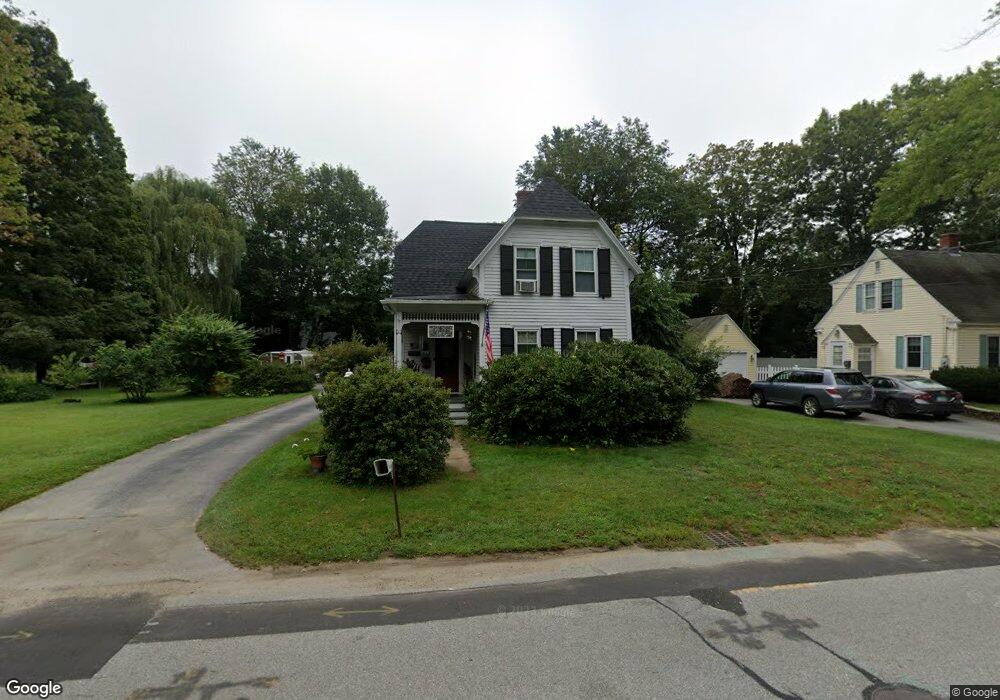
97 Rockingham St Concord, NH 03301
South End NeighborhoodEstimated Value: $549,820 - $626,000
4
Beds
2
Baths
1,968
Sq Ft
$295/Sq Ft
Est. Value
About This Home
This home is located at 97 Rockingham St, Concord, NH 03301 and is currently estimated at $581,455, approximately $295 per square foot. 97 Rockingham St is a home located in Merrimack County with nearby schools including Abbot-Downing School, Rundlett Middle School, and Concord High School.
Ownership History
Date
Name
Owned For
Owner Type
Purchase Details
Closed on
Jul 24, 2024
Sold by
Beyer Stephen A and Beyer Bonnie L
Bought by
Beyer Ft 2024 and Beyer
Current Estimated Value
Purchase Details
Closed on
Jan 28, 1988
Bought by
Beyer Stephen A and Beyer Bonnie L
Create a Home Valuation Report for This Property
The Home Valuation Report is an in-depth analysis detailing your home's value as well as a comparison with similar homes in the area
Home Values in the Area
Average Home Value in this Area
Purchase History
| Date | Buyer | Sale Price | Title Company |
|---|---|---|---|
| Beyer Ft 2024 | -- | None Available | |
| Beyer Ft 2024 | -- | None Available | |
| Beyer Stephen A | $178,000 | -- |
Source: Public Records
Mortgage History
| Date | Status | Borrower | Loan Amount |
|---|---|---|---|
| Previous Owner | Beyer Stephen A | $25,000 | |
| Previous Owner | Beyer Stephen A | $104,200 | |
| Previous Owner | Beyer Stephen A | $108,000 | |
| Previous Owner | Beyer Stephen A | $150,000 |
Source: Public Records
Tax History Compared to Growth
Tax History
| Year | Tax Paid | Tax Assessment Tax Assessment Total Assessment is a certain percentage of the fair market value that is determined by local assessors to be the total taxable value of land and additions on the property. | Land | Improvement |
|---|---|---|---|---|
| 2024 | $10,218 | $369,000 | $116,400 | $252,600 |
| 2023 | $9,911 | $369,000 | $116,400 | $252,600 |
| 2022 | $9,553 | $369,000 | $116,400 | $252,600 |
| 2021 | $9,151 | $364,300 | $116,400 | $247,900 |
| 2020 | $8,919 | $333,300 | $93,000 | $240,300 |
| 2019 | $8,287 | $298,300 | $91,200 | $207,100 |
| 2018 | $8,079 | $286,600 | $91,200 | $195,400 |
| 2017 | $7,752 | $274,500 | $91,200 | $183,300 |
| 2016 | $7,355 | $265,800 | $89,400 | $176,400 |
| 2015 | $6,961 | $250,400 | $93,400 | $157,000 |
| 2014 | $6,713 | $250,400 | $93,400 | $157,000 |
| 2013 | -- | $250,400 | $93,400 | $157,000 |
| 2012 | -- | $256,100 | $93,400 | $162,700 |
Source: Public Records
Map
Nearby Homes
- 99 Rockingham St
- 96 Rockingham St
- 11 Goldenrod Ln
- 249 South St
- 93 Rockingham St
- 7 Goldenrod Ln
- 251 South St
- 17 Goldenrod Ln
- 255 South St
- 245 South St
- 257 South St
- 94 Rockingham St
- 91 Rockingham St
- 21 Goldenrod Ln
- 243 South St
- 18 Goldenrod Ln
- 92 Rockingham St
- 89 Rockingham St
- 252 South St
- 2 Goldenrod Ln