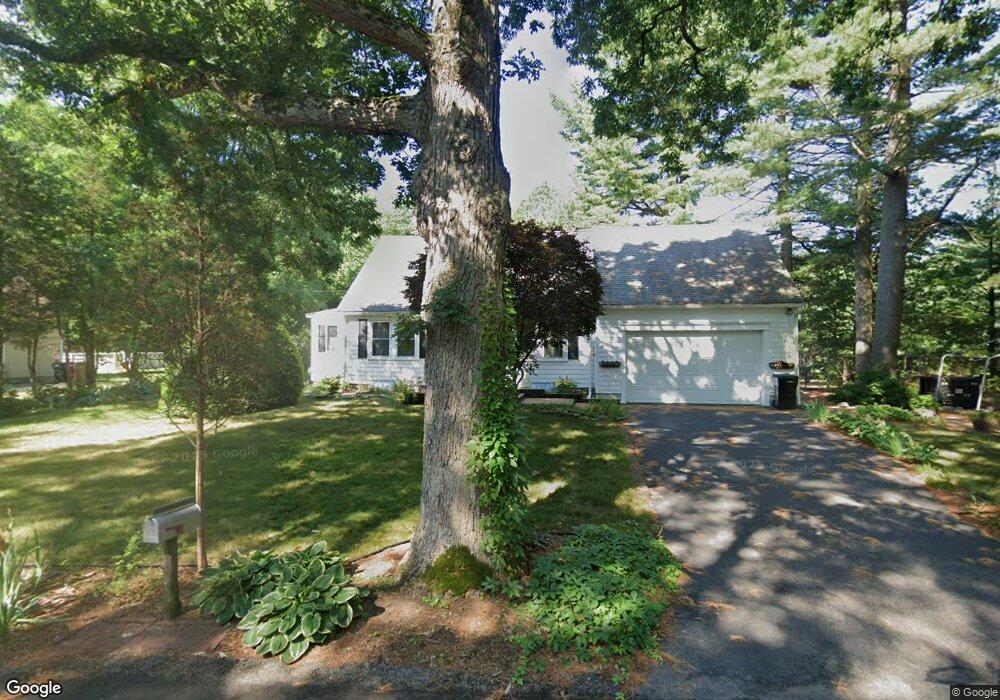
97 S High St Foxboro, MA 02035
Estimated Value: $599,000 - $624,000
2
Beds
2
Baths
1,792
Sq Ft
$344/Sq Ft
Est. Value
About This Home
This home is located at 97 S High St, Foxboro, MA 02035 and is currently estimated at $616,556, approximately $344 per square foot. 97 S High St is a home located in Norfolk County with nearby schools including Foxborough High School, Foxborough Regional Charter School, and Hands-On-Montessori School.
Ownership History
Date
Name
Owned For
Owner Type
Purchase Details
Closed on
Nov 15, 2018
Sold by
Haskell James W
Bought by
James W Haskell Lt
Current Estimated Value
Purchase Details
Closed on
Aug 29, 2007
Sold by
Haskell Barbara A
Bought by
South High Street Rt
Create a Home Valuation Report for This Property
The Home Valuation Report is an in-depth analysis detailing your home's value as well as a comparison with similar homes in the area
Home Values in the Area
Average Home Value in this Area
Purchase History
| Date | Buyer | Sale Price | Title Company |
|---|---|---|---|
| James W Haskell Lt | -- | -- | |
| South High Street Rt | -- | -- |
Source: Public Records
Tax History
| Year | Tax Paid | Tax Assessment Tax Assessment Total Assessment is a certain percentage of the fair market value that is determined by local assessors to be the total taxable value of land and additions on the property. | Land | Improvement |
|---|---|---|---|---|
| 2025 | $6,577 | $497,500 | $206,300 | $291,200 |
| 2024 | $6,219 | $460,300 | $206,300 | $254,000 |
| 2023 | $6,093 | $428,800 | $196,500 | $232,300 |
| 2022 | $5,975 | $411,500 | $187,900 | $223,600 |
| 2021 | $5,634 | $382,200 | $170,900 | $211,300 |
| 2020 | $5,440 | $373,400 | $170,900 | $202,500 |
| 2019 | $5,098 | $346,800 | $162,700 | $184,100 |
| 2018 | $4,814 | $330,400 | $162,700 | $167,700 |
| 2017 | $4,524 | $300,800 | $152,100 | $148,700 |
| 2016 | $4,357 | $294,000 | $146,400 | $147,600 |
| 2015 | $4,121 | $271,300 | $123,700 | $147,600 |
| 2014 | $4,029 | $268,800 | $121,200 | $147,600 |
Source: Public Records
Map
Nearby Homes
- 356 Central St
- 1769 West St
- 233 Central St
- 166 Chauncy St
- 155 South St
- 346 South St
- 157 Central St
- 150 Rumford Ave Unit 110
- 619 N Main St
- 266 N Main St Unit 3
- 25 Kingman Ave
- 22 Pleasant St Unit B
- 67 Carpenter St
- 81 Chilson Ave
- 28 Court St
- 13 Summerville Rd Unit 13
- 128 Tremont St
- 44 Fairfield Park Unit 44
- 122 Samoset Ave
- 26 Fuller Rd Unit 6
Your Personal Tour Guide
Ask me questions while you tour the home.