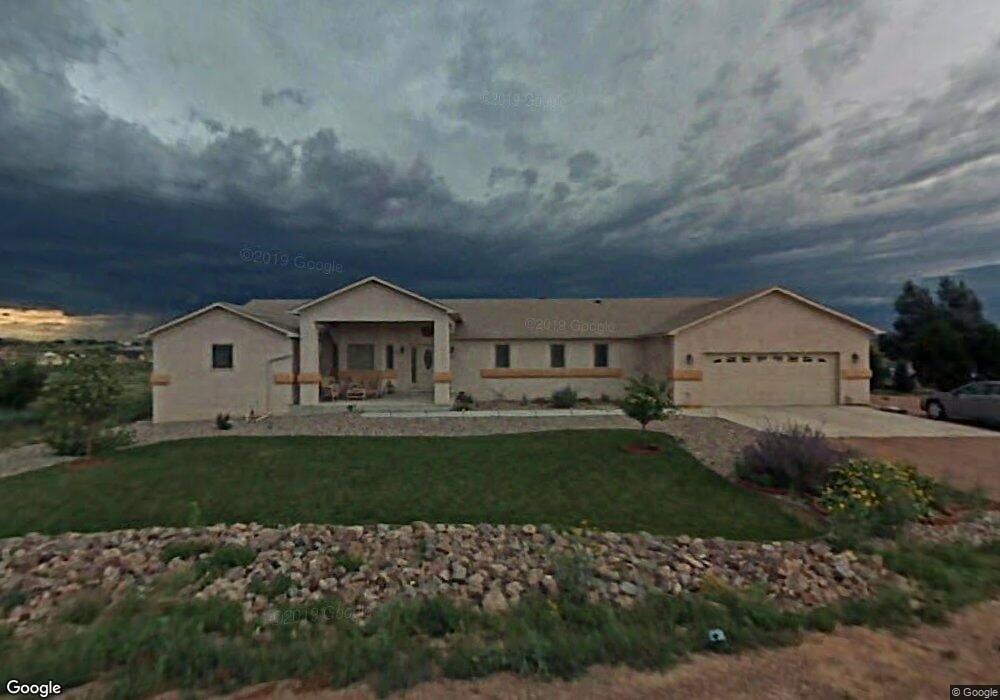
97 S Siesta Dr Unit 7 Pueblo, CO 81007
Estimated Value: $441,000 - $636,000
3
Beds
3
Baths
2,651
Sq Ft
$201/Sq Ft
Est. Value
About This Home
This home is located at 97 S Siesta Dr Unit 7, Pueblo, CO 81007 and is currently estimated at $531,751, approximately $200 per square foot. 97 S Siesta Dr Unit 7 is a home located in Pueblo County with nearby schools including Cedar Ridge Elementary School, Sky View Middle School, and Pueblo West High School.
Ownership History
Date
Name
Owned For
Owner Type
Purchase Details
Closed on
Nov 3, 2004
Sold by
Shatto Nellie C
Bought by
Gossard J R Sr + A C
Current Estimated Value
Purchase Details
Closed on
Aug 19, 1996
Sold by
Colorado Mountain Dev Inc
Bought by
Shatto Nellie C
Purchase Details
Closed on
Sep 22, 1995
Sold by
Taylor Richard S + Jennifer L
Bought by
Colorado Mountain Dev Inc
Purchase Details
Closed on
Aug 21, 1995
Sold by
Colorado Mountain Dev Inc
Bought by
Taylor Richard S + Jennifer L
Purchase Details
Closed on
Dec 15, 1994
Bought by
Colorado Mountain Dev Inc
Purchase Details
Closed on
Sep 27, 1994
Sold by
Hennigar Harry J
Bought by
Raincrest Associates Llc
Purchase Details
Closed on
Nov 2, 1979
Sold by
Lawyers Title Of Pueblo
Bought by
Hennigar Harry J
Create a Home Valuation Report for This Property
The Home Valuation Report is an in-depth analysis detailing your home's value as well as a comparison with similar homes in the area
Home Values in the Area
Average Home Value in this Area
Purchase History
| Date | Buyer | Sale Price | Title Company |
|---|---|---|---|
| Gossard J R Sr + A C | $18,500 | -- | |
| Shatto Nellie C | $13,000 | -- | |
| Colorado Mountain Dev Inc | -- | -- | |
| Taylor Richard S + Jennifer L | $13,000 | -- | |
| Colorado Mountain Dev Inc | $45,000 | -- | |
| Raincrest Associates Llc | $1,000 | -- | |
| Hennigar Harry J | -- | -- |
Source: Public Records
Tax History Compared to Growth
Tax History
| Year | Tax Paid | Tax Assessment Tax Assessment Total Assessment is a certain percentage of the fair market value that is determined by local assessors to be the total taxable value of land and additions on the property. | Land | Improvement |
|---|---|---|---|---|
| 2024 | $2,474 | $31,270 | -- | -- |
| 2023 | $2,504 | $34,960 | $3,920 | $31,040 |
| 2022 | $1,498 | $21,792 | $2,690 | $19,102 |
| 2021 | $1,536 | $22,420 | $2,770 | $19,650 |
| 2020 | $1,809 | $27,880 | $2,770 | $25,110 |
| 2019 | $1,805 | $25,117 | $1,073 | $24,044 |
| 2018 | $1,571 | $22,818 | $900 | $21,918 |
| 2017 | $1,573 | $22,818 | $900 | $21,918 |
| 2016 | $1,416 | $22,058 | $1,433 | $20,625 |
| 2015 | $1,093 | $22,058 | $1,433 | $20,625 |
| 2014 | $1,003 | $20,218 | $1,433 | $18,785 |
Source: Public Records
Map
Nearby Homes
- 53 S Rancho Vista Dr
- 301 S Costilla Ct
- 1160 W Mcculloch Blvd N
- 1125 W Mcculloch Blvd N
- 1837 W Costilla Plaza
- 1867 W Costilla Dr
- 376 S Hidalgo Dr
- 275 S Hidalgo Dr
- 526 S Chimazo Dr
- 504 S Meredith Dr
- 1037 W Desert Sage Dr
- 2046 W Hesperus Dr
- 477 S Escalante Dr
- 438 S Arriba Dr
- 567 S Chimazo Dr
- 1880 W Escalante Ct
- 573 S Chimazo Dr
- 497 S Avenida Del Oro E
- 964 W Moccasin Dr
- 556 S Chimazo Dr
- 97 S Siesta Dr
- 1597 Caballo Dr
- 89 S Siesta Dr
- 109 S Siesta Dr Unit 8
- 109 S Siesta Dr
- 1598 W Caballo Dr
- 96 S Siesta Dr
- 90 S Siesta Dr Unit 7
- 90 S Siesta Dr
- 127 S Siesta Dr
- 127 S Siesta Dr Unit 9
- 81 S Siesta Dr Unit 5
- 126 S Siesta Dr
- 126 S Siesta Dr Unit 17
- 129 S Siesta Dr
- 76 S Siesta Dr
- 73 S Siesta Dr Unit 4
- 73 S Siesta Dr
- 1586 W Caballo Dr
- 1579 W Caballo Dr