97 Seavey Rd Belmont, NH 03220
Estimated Value: $396,000 - $511,000
3
Beds
2
Baths
897
Sq Ft
$525/Sq Ft
Est. Value
About This Home
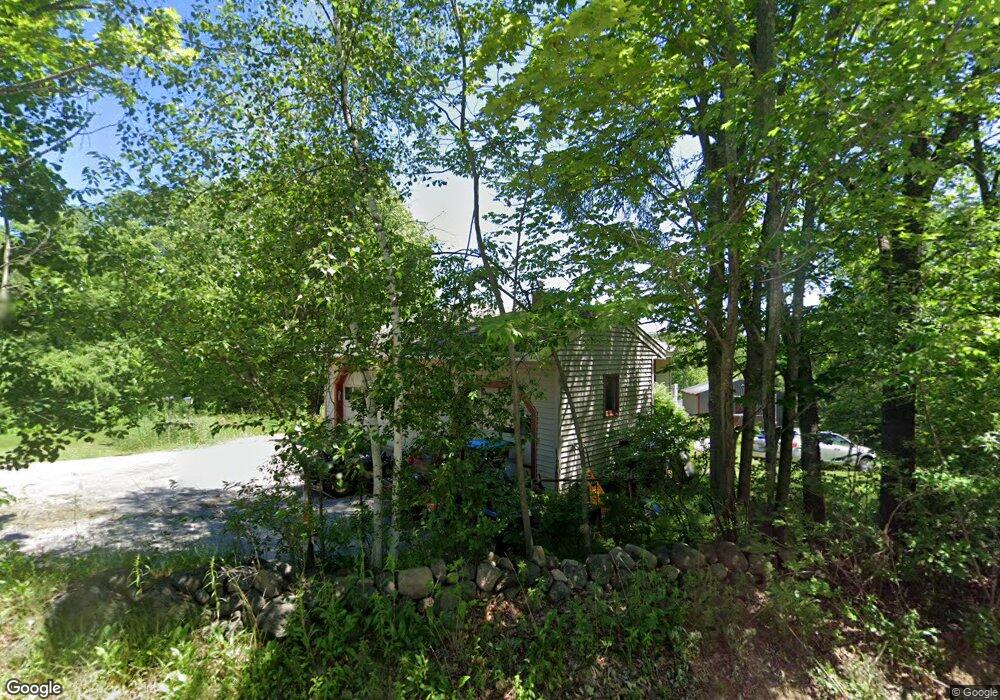
This home is located at 97 Seavey Rd, Belmont, NH 03220 and is currently estimated at $470,662, approximately $524 per square foot. 97 Seavey Rd is a home with nearby schools including Belmont Elementary School, Belmont Middle School, and Belmont High School.
Ownership History
Date
Name
Owned For
Owner Type
Purchase Details
Closed on
Dec 6, 2019
Sold by
Fletcher John R and Fletcher Karyl B
Bought by
Jk Fletcher Ft and Fletcher
Current Estimated Value
Purchase Details
Closed on
Sep 1, 2000
Sold by
Akerstrom Mark A and Akerstrom Sharon M
Bought by
Fletcher John R and Fletcher Karyl B
Home Financials for this Owner
Home Financials are based on the most recent Mortgage that was taken out on this home.
Original Mortgage
$105,600
Interest Rate
8.16%
Mortgage Type
Purchase Money Mortgage
Create a Home Valuation Report for This Property
The Home Valuation Report is an in-depth analysis detailing your home's value as well as a comparison with similar homes in the area
Home Values in the Area
Average Home Value in this Area
Purchase History
| Date | Buyer | Sale Price | Title Company |
|---|---|---|---|
| Jk Fletcher Ft | -- | None Available | |
| Fletcher John R | $132,000 | -- |
Source: Public Records
Mortgage History
| Date | Status | Borrower | Loan Amount |
|---|---|---|---|
| Previous Owner | Fletcher John R | $167,500 | |
| Previous Owner | Fletcher John R | $173,700 | |
| Previous Owner | Fletcher John R | $105,600 |
Source: Public Records
Tax History Compared to Growth
Tax History
| Year | Tax Paid | Tax Assessment Tax Assessment Total Assessment is a certain percentage of the fair market value that is determined by local assessors to be the total taxable value of land and additions on the property. | Land | Improvement |
|---|---|---|---|---|
| 2024 | $6,220 | $395,168 | $105,168 | $290,000 |
| 2023 | $6,027 | $344,968 | $85,068 | $259,900 |
| 2022 | $6,086 | $318,468 | $76,768 | $241,700 |
| 2021 | $5,821 | $218,261 | $57,561 | $160,700 |
| 2020 | $5,531 | $218,261 | $57,561 | $160,700 |
| 2019 | $5,459 | $218,265 | $57,565 | $160,700 |
| 2017 | $5,483 | $186,125 | $55,125 | $131,000 |
| 2016 | $5,320 | $184,529 | $55,129 | $129,400 |
| 2015 | $5,217 | $184,532 | $55,132 | $129,400 |
| 2014 | $5,102 | $184,532 | $55,132 | $129,400 |
| 2013 | $5,068 | $225,836 | $82,836 | $143,000 |
Source: Public Records
Map
Nearby Homes