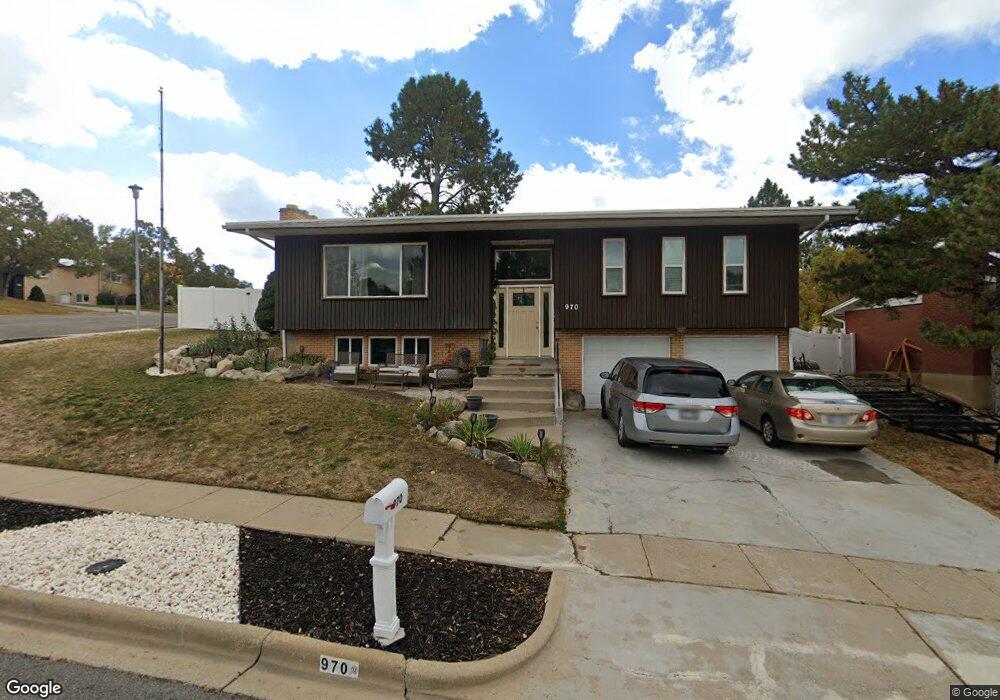
970 E 2050 S Bountiful, UT 84010
Estimated Value: $572,112 - $631,000
4
Beds
3
Baths
2,181
Sq Ft
$277/Sq Ft
Est. Value
About This Home
This home is located at 970 E 2050 S, Bountiful, UT 84010 and is currently estimated at $603,278, approximately $276 per square foot. 970 E 2050 S is a home located in Davis County with nearby schools including Muir School, Mueller Park Junior High School, and Bountiful High School.
Ownership History
Date
Name
Owned For
Owner Type
Purchase Details
Closed on
Mar 9, 2020
Sold by
Kay Nicole G and Kay Benjamin P
Bought by
Haviland Kade G and Haviland Jessica M
Current Estimated Value
Home Financials for this Owner
Home Financials are based on the most recent Mortgage that was taken out on this home.
Original Mortgage
$320,100
Outstanding Balance
$284,029
Interest Rate
3.6%
Mortgage Type
New Conventional
Estimated Equity
$319,249
Purchase Details
Closed on
Nov 22, 2005
Sold by
Giauque Gerald S and Giauque Alice H
Bought by
Kay Benjamin P and Kay Nicole G
Home Financials for this Owner
Home Financials are based on the most recent Mortgage that was taken out on this home.
Original Mortgage
$142,000
Interest Rate
5.37%
Mortgage Type
Fannie Mae Freddie Mac
Purchase Details
Closed on
Jan 15, 2004
Sold by
Westien Donald H and Westien Mary Jo
Bought by
Giauque Gerald S and Giauque Alice H
Purchase Details
Closed on
Jan 11, 2001
Sold by
Westien Donald H and Westien Mary Jo
Bought by
Westien Donald H and Westien Mary Jo
Create a Home Valuation Report for This Property
The Home Valuation Report is an in-depth analysis detailing your home's value as well as a comparison with similar homes in the area
Purchase History
| Date | Buyer | Sale Price | Title Company |
|---|---|---|---|
| Haviland Kade G | -- | North American Title | |
| Kay Benjamin P | -- | Equity Title Ins Agency Inc | |
| Giauque Gerald S | -- | Equity Title Agency | |
| Westien Donald H | -- | -- |
Source: Public Records
Mortgage History
| Date | Status | Borrower | Loan Amount |
|---|---|---|---|
| Open | Haviland Kade G | $320,100 | |
| Previous Owner | Kay Benjamin P | $142,000 |
Source: Public Records
Tax History
| Year | Tax Paid | Tax Assessment Tax Assessment Total Assessment is a certain percentage of the fair market value that is determined by local assessors to be the total taxable value of land and additions on the property. | Land | Improvement |
|---|---|---|---|---|
| 2025 | $3,062 | $279,400 | $117,413 | $161,987 |
| 2024 | $2,849 | $269,500 | $108,400 | $161,100 |
| 2023 | $2,740 | $470,000 | $194,659 | $275,341 |
| 2022 | $2,727 | $256,300 | $103,392 | $152,908 |
| 2021 | $2,510 | $361,000 | $153,511 | $207,489 |
| 2020 | $2,219 | $320,000 | $139,822 | $180,178 |
| 2019 | $2,327 | $316,000 | $141,968 | $174,032 |
| 2018 | $2,065 | $286,000 | $131,297 | $154,703 |
| 2016 | $1,792 | $134,365 | $40,232 | $94,133 |
| 2015 | $1,748 | $122,925 | $40,232 | $82,693 |
| 2014 | $1,727 | $125,776 | $40,232 | $85,544 |
| 2013 | -- | $114,755 | $41,469 | $73,286 |
Source: Public Records
Map
Nearby Homes
- 994 Deborah Dr
- 2136 S 900 E
- 2156 Elaine Dr
- 831 E San Simeon Way S
- 761 San Simeon Way
- 1087 Arlington Way
- 1888 S 1150 E
- 1761 S Davis Blvd
- 1885 Spring Creek Dr
- 631 E 1700 S
- 1886 S Jeri Dr
- 0 Bountiful Blvd
- 610 Meadowlark Ln
- 2053 S 350 E Unit 7
- 775 E 1500 S
- 2059 S 350 E Unit 6
- 2115 S Ridgewood Way
- 295 E 2050 S Unit 1
- 2046 S 350 E Unit 4
- 2038 S 350 E Unit 3
Your Personal Tour Guide
Ask me questions while you tour the home.