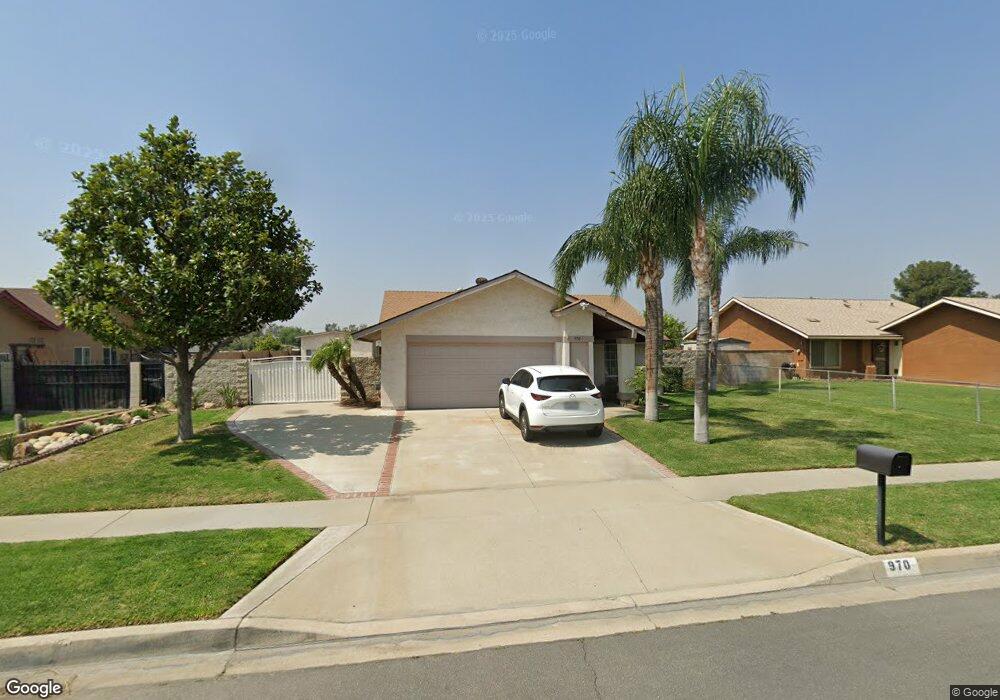
970 S Millard Ave Rialto, CA 92376
Estimated Value: $492,000 - $554,000
4
Beds
2
Baths
1,242
Sq Ft
$421/Sq Ft
Est. Value
About This Home
This home is located at 970 S Millard Ave, Rialto, CA 92376 and is currently estimated at $522,496, approximately $420 per square foot. 970 S Millard Ave is a home located in San Bernardino County with nearby schools including Samuel W. Simpson Elementary School, Rialto Middle School, and Rialto High School.
Ownership History
Date
Name
Owned For
Owner Type
Purchase Details
Closed on
Jan 31, 2023
Sold by
Sosa Oscar M
Bought by
Sosa Oscar Ni and Schofield Josepha Anadely
Current Estimated Value
Purchase Details
Closed on
Apr 15, 2005
Sold by
Lara Jose Pastor and Lara Maria Teresa
Bought by
Lara Jose Pastor and Lara Maria Teresa
Home Financials for this Owner
Home Financials are based on the most recent Mortgage that was taken out on this home.
Original Mortgage
$222,400
Interest Rate
5.84%
Mortgage Type
New Conventional
Purchase Details
Closed on
Oct 17, 2001
Sold by
Cox Lyle M and Cox Ann P
Bought by
Sosa Oscar M
Home Financials for this Owner
Home Financials are based on the most recent Mortgage that was taken out on this home.
Original Mortgage
$108,400
Interest Rate
6.67%
Create a Home Valuation Report for This Property
The Home Valuation Report is an in-depth analysis detailing your home's value as well as a comparison with similar homes in the area
Home Values in the Area
Average Home Value in this Area
Purchase History
| Date | Buyer | Sale Price | Title Company |
|---|---|---|---|
| Sosa Oscar Ni | -- | -- | |
| Lara Jose Pastor | -- | Southland Title | |
| Sosa Oscar M | $135,500 | Old Republic Title Company |
Source: Public Records
Mortgage History
| Date | Status | Borrower | Loan Amount |
|---|---|---|---|
| Previous Owner | Lara Jose Pastor | $222,400 | |
| Previous Owner | Sosa Oscar M | $108,400 | |
| Closed | Sosa Oscar M | $27,100 |
Source: Public Records
Tax History
| Year | Tax Paid | Tax Assessment Tax Assessment Total Assessment is a certain percentage of the fair market value that is determined by local assessors to be the total taxable value of land and additions on the property. | Land | Improvement |
|---|---|---|---|---|
| 2025 | $2,844 | $200,177 | $50,045 | $150,132 |
| 2024 | $2,734 | $196,252 | $49,064 | $147,188 |
| 2023 | $2,888 | $192,404 | $48,102 | $144,302 |
| 2022 | $2,672 | $188,632 | $47,159 | $141,473 |
| 2021 | $2,655 | $184,933 | $46,234 | $138,699 |
| 2020 | $2,659 | $183,037 | $45,760 | $137,277 |
| 2019 | $2,605 | $179,448 | $44,863 | $134,585 |
| 2018 | $2,516 | $175,929 | $43,983 | $131,946 |
| 2017 | $2,498 | $172,480 | $43,121 | $129,359 |
| 2016 | $2,134 | $169,098 | $42,275 | $126,823 |
| 2015 | $2,141 | $166,558 | $41,640 | $124,918 |
| 2014 | $2,012 | $163,295 | $40,824 | $122,471 |
Source: Public Records
Map
Nearby Homes
- 520 W Randall Ave
- 548 Bloomington Ave
- 225 W Alru St
- 200 W San Bernardino Ave Unit 19
- 200 W San Bernardino Ave Unit 3
- 200 W San Bernardino Ave Unit 85
- 200 W San Bernardino Ave Unit 76
- 200 W San Bernardino Ave Unit 72
- 200 W San Bernardino Ave Unit 132
- 125 W Alru St
- 731 S Orange Ave
- 1025 S Riverside Ave Unit 66
- 616 S Millard Ave
- 1155 S Riverside Ave Unit 22
- 1155 S Riverside Ave Unit 7
- 1208 S Fillmore Ave
- 340 Lilly St
- 405 W Merrill Ave
- 993 S Date Ave
- 778 Bloomington Ave
- 960 S Millard Ave
- 980 S Millard Ave
- 1010 S Millard Ave
- 950 S Millard Ave
- 369 W Montrose St
- 959 S Millard Ave
- 959 S Millard Ave
- 1009 S Millard Ave
- 1020 S Millard Ave
- 940 S Millard Ave
- 359 W Montrose St
- 949 S Millard Ave
- 949 S Millard Ave
- 1019 S Millard Ave
- 960 S Clifford Ave
- 349 W Montrose St
- 939 S Millard Ave
- 1030 S Millard Ave
- 930 S Millard Ave
- 950 S Clifford Ave
Your Personal Tour Guide
Ask me questions while you tour the home.