Estimated Value: $846,078 - $881,000
4
Beds
3
Baths
1,652
Sq Ft
$525/Sq Ft
Est. Value
About This Home
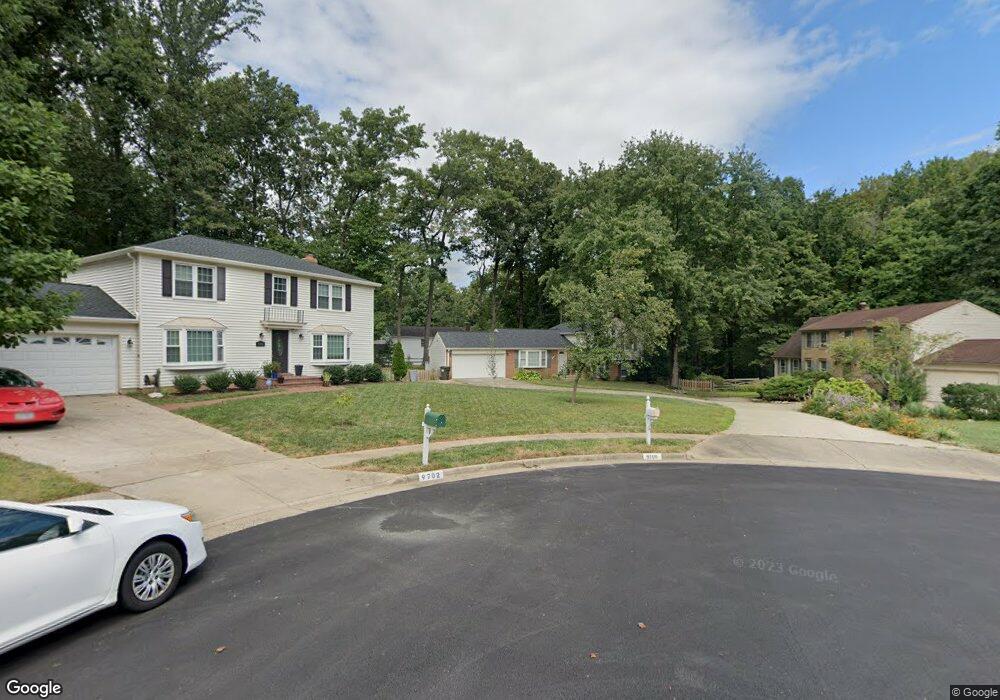
This home is located at 9700 Glenway Ct, Burke, VA 22015 and is currently estimated at $867,270, approximately $524 per square foot. 9700 Glenway Ct is a home located in Fairfax County with nearby schools including Cherry Run Elementary School, Lake Braddock Secondary School, and Nativity Catholic School.
Ownership History
Date
Name
Owned For
Owner Type
Purchase Details
Closed on
Apr 14, 2008
Sold by
Henna Dallas L
Bought by
Disilvio Elizabeth J
Current Estimated Value
Home Financials for this Owner
Home Financials are based on the most recent Mortgage that was taken out on this home.
Original Mortgage
$300,000
Outstanding Balance
$193,283
Interest Rate
6.3%
Mortgage Type
New Conventional
Estimated Equity
$673,987
Purchase Details
Closed on
Aug 15, 1997
Sold by
Reising Lavern and Reising Marion
Bought by
Henna Dallas L and Henna Daisy
Home Financials for this Owner
Home Financials are based on the most recent Mortgage that was taken out on this home.
Original Mortgage
$183,200
Interest Rate
7.56%
Mortgage Type
New Conventional
Purchase Details
Closed on
Apr 26, 1994
Sold by
Federal National Mortgage Association
Bought by
Reising Lavern
Home Financials for this Owner
Home Financials are based on the most recent Mortgage that was taken out on this home.
Original Mortgage
$172,900
Interest Rate
7.6%
Purchase Details
Closed on
Dec 17, 1993
Sold by
Yi
Bought by
Fed Natl Mtge Assoc
Create a Home Valuation Report for This Property
The Home Valuation Report is an in-depth analysis detailing your home's value as well as a comparison with similar homes in the area
Home Values in the Area
Average Home Value in this Area
Purchase History
| Date | Buyer | Sale Price | Title Company |
|---|---|---|---|
| Disilvio Elizabeth J | $518,000 | -- | |
| Henna Dallas L | $229,000 | -- | |
| Reising Lavern | $182,000 | -- | |
| Fed Natl Mtge Assoc | $169,484 | -- |
Source: Public Records
Mortgage History
| Date | Status | Borrower | Loan Amount |
|---|---|---|---|
| Open | Disilvio Elizabeth J | $300,000 | |
| Previous Owner | Fed Natl Mtge Assoc | $183,200 | |
| Previous Owner | Fed Natl Mtge Assoc | $172,900 |
Source: Public Records
Tax History Compared to Growth
Tax History
| Year | Tax Paid | Tax Assessment Tax Assessment Total Assessment is a certain percentage of the fair market value that is determined by local assessors to be the total taxable value of land and additions on the property. | Land | Improvement |
|---|---|---|---|---|
| 2025 | $8,768 | $805,960 | $318,000 | $487,960 |
| 2024 | $8,768 | $756,880 | $303,000 | $453,880 |
| 2023 | $8,039 | $712,340 | $283,000 | $429,340 |
| 2022 | $8,146 | $712,410 | $283,000 | $429,410 |
| 2021 | $7,417 | $632,000 | $248,000 | $384,000 |
| 2020 | $7,187 | $607,260 | $230,000 | $377,260 |
| 2019 | $7,187 | $607,260 | $230,000 | $377,260 |
| 2018 | $6,917 | $601,520 | $228,000 | $373,520 |
| 2017 | $6,802 | $585,890 | $223,000 | $362,890 |
| 2016 | $6,442 | $556,030 | $218,000 | $338,030 |
| 2015 | $6,306 | $565,080 | $218,000 | $347,080 |
| 2014 | $5,992 | $538,140 | $208,000 | $330,140 |
Source: Public Records
Map
Nearby Homes
- 9616 Villagesmith Way
- 6507 Burke Woods Dr
- 9515 Debra Spradlin Ct
- 9462 Wooded Glen Ave
- 9472 Lapstrake Ln
- 7104 Park Point Ct
- 9405 William Kirk Ln
- 9523 Cherry Oak Ct
- 6111 Wilmington Dr
- 9505 Scorpio Ln
- 6312 Teakwood Ct
- 7209 Reservation Dr
- 6122 Mantle Rd
- 10114 Marshall Pond Rd
- 6314 Draco St
- 9175 Broken Oak Place Unit 39B
- 9849 S Park Cir
- 9427 Candleberry Ct
- 6003 Lincolnwood Ct
- 9211 Beachway Ln
- 9702 Glenway Ct
- 9705 Schmidt Dr
- 9701 Glenway Ct
- 9703 Schmidt Dr
- 9707 Schmidt Dr
- 9703 Glenway Ct
- 9709 Schmidt Dr
- 9711 Schmidt Dr
- 9705 Glenway Ct
- 9701 Schmidt Dr
- 9713 Schmidt Dr
- 9706 Glenway Ct
- 9707 Glenway Ct
- 9706 Schmidt Dr
- 9704 Schmidt Dr
- 9708 Schmidt Dr
- 9710 Schmidt Dr
- 9715 Schmidt Dr
- 9722 Rossetti Ct
- 9712 Schmidt Dr