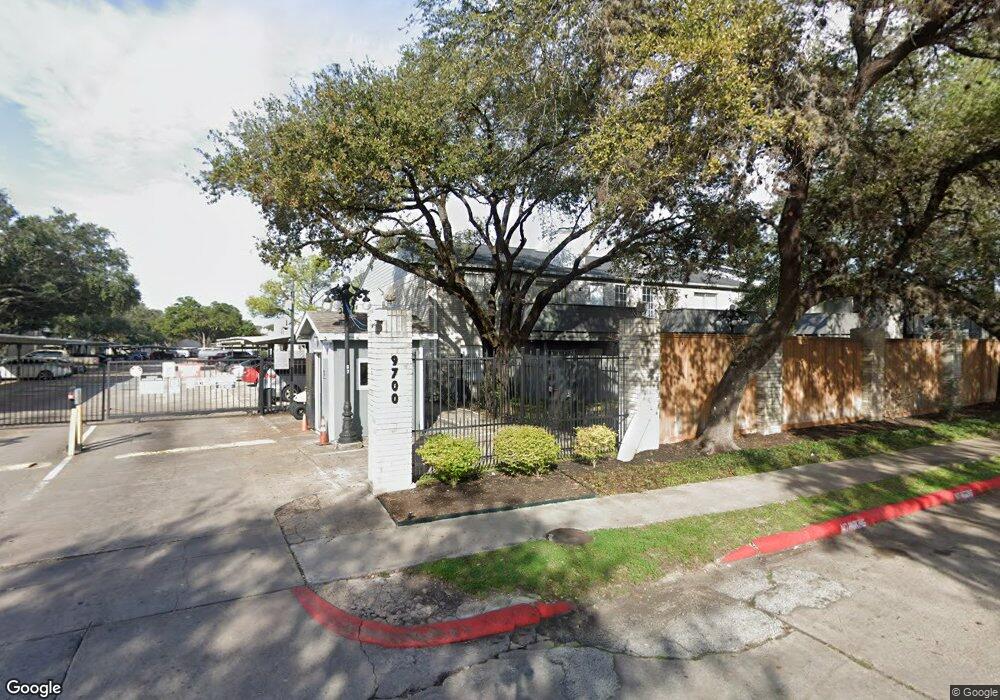
9700 Leawood Blvd Unit 9901 Houston, TX 77099
Alief NeighborhoodEstimated Value: $85,119 - $98,000
2
Beds
2
Baths
1,084
Sq Ft
$86/Sq Ft
Est. Value
About This Home
This home is located at 9700 Leawood Blvd Unit 9901, Houston, TX 77099 and is currently estimated at $92,780, approximately $85 per square foot. 9700 Leawood Blvd Unit 9901 is a home located in Harris County with nearby schools including Smith Elementary School, Klentzman Intermediate School, and Olle Middle School.
Ownership History
Date
Name
Owned For
Owner Type
Purchase Details
Closed on
Aug 3, 2022
Sold by
Ul Haq Shan
Bought by
Brewer Family Enterprises Inc
Current Estimated Value
Purchase Details
Closed on
Aug 2, 2022
Sold by
Ul Haq Shan
Bought by
Brewer Family Enterprises Inc
Purchase Details
Closed on
Nov 1, 2018
Sold by
Haroon Yaqoob
Bought by
Haq Shan Ul
Purchase Details
Closed on
May 3, 2018
Sold by
Dudas Milan
Bought by
Highstar Family Trust
Purchase Details
Closed on
Jul 10, 2014
Sold by
Church Ecclesia
Bought by
Dudas Milan
Purchase Details
Closed on
Nov 28, 2011
Sold by
Goddard David
Bought by
Church Ecclesia
Purchase Details
Closed on
Sep 15, 2011
Sold by
Reese D Anerol
Bought by
Goddard David
Purchase Details
Closed on
Aug 2, 2005
Sold by
Goddard David
Bought by
Reese D Anerol
Purchase Details
Closed on
Dec 26, 2003
Sold by
Wilkins R Bruce
Bought by
Goddard David
Create a Home Valuation Report for This Property
The Home Valuation Report is an in-depth analysis detailing your home's value as well as a comparison with similar homes in the area
Home Values in the Area
Average Home Value in this Area
Purchase History
| Date | Buyer | Sale Price | Title Company |
|---|---|---|---|
| Brewer Family Enterprises Inc | -- | None Listed On Document | |
| Brewer Family Enterprises Inc | -- | None Listed On Document | |
| Haq Shan Ul | -- | None Available | |
| Highstar Family Trust | -- | None Available | |
| Dudas Milan | -- | None Available | |
| Church Ecclesia | -- | None Available | |
| Goddard David | -- | None Available | |
| Reese D Anerol | -- | None Available | |
| Goddard David | -- | -- |
Source: Public Records
Tax History Compared to Growth
Tax History
| Year | Tax Paid | Tax Assessment Tax Assessment Total Assessment is a certain percentage of the fair market value that is determined by local assessors to be the total taxable value of land and additions on the property. | Land | Improvement |
|---|---|---|---|---|
| 2025 | $1,997 | $86,417 | $16,419 | $69,998 |
| 2024 | $1,997 | $87,906 | $16,702 | $71,204 |
| 2023 | $1,997 | $87,906 | $16,702 | $71,204 |
| 2022 | $1,712 | $70,556 | $13,406 | $57,150 |
| 2021 | $1,501 | $61,477 | $11,681 | $49,796 |
| 2020 | $1,555 | $61,477 | $11,681 | $49,796 |
| 2019 | $1,552 | $56,357 | $10,708 | $45,649 |
| 2018 | $224 | $53,498 | $10,165 | $43,333 |
| 2017 | $1,038 | $49,914 | $9,484 | $40,430 |
| 2016 | $943 | $38,865 | $7,384 | $31,481 |
| 2015 | $738 | $31,454 | $5,976 | $25,478 |
| 2014 | $738 | $27,816 | $5,285 | $22,531 |
Source: Public Records
Map
Nearby Homes
- 9700 Leawood Blvd Unit 1214
- 9700 Leawood Blvd Unit 1405
- 9700 Leawood Blvd Unit 404
- 9700 Leawood Blvd Unit 1105
- 9700 Leawood Blvd Unit 406
- 9700 Leawood Blvd Unit 1601
- 9700 Leawood Blvd Unit 1807
- 9700 Leawood Blvd Unit 216
- 9700 Leawood Blvd Unit 308
- 9700 Leawood Blvd Unit 2110
- 9797 Leawood Blvd Unit 601
- 9797 Leawood Blvd Unit 303
- 9797 Leawood Blvd Unit 1411
- 9797 Leawood Blvd Unit 408
- 9797 Leawood Blvd Unit 607
- 9797 Leawood Blvd Unit 206
- 9797 Leawood Blvd Unit 903
- 9797 Leawood Blvd Unit 1008
- 11106 Lewis Dr
- 9319 Belle Park Dr
- 9700 Leawood Blvd Unit 802
- 9700 Leawood Blvd Unit 8803
- 9700 Leawood Blvd Unit 8802
- 9700 Leawood Blvd Unit 8801
- 9700 Leawood Blvd Unit 1202
- 9700 Leawood Blvd Unit 1201
- 9700 Leawood Blvd Unit 9916
- 9700 Leawood Blvd Unit 9915
- 9700 Leawood Blvd Unit 9914
- 9700 Leawood Blvd Unit 9913
- 9700 Leawood Blvd Unit 912
- 9700 Leawood Blvd Unit 9911
- 9700 Leawood Blvd Unit 9910
- 9700 Leawood Blvd Unit 9909
- 9700 Leawood Blvd Unit 9908
- 9700 Leawood Blvd Unit 9907
- 9700 Leawood Blvd Unit 9906
- 9700 Leawood Blvd Unit 9905
- 9700 Leawood Blvd Unit 9904
- 9700 Leawood Blvd Unit 9903