9701 Bellasera Cir Myrtle Beach, SC 29579
Grande Dunes NeighborhoodEstimated Value: $3,127,000 - $4,449,000
4
Beds
6
Baths
8,074
Sq Ft
$492/Sq Ft
Est. Value
About This Home
This home is located at 9701 Bellasera Cir, Myrtle Beach, SC 29579 and is currently estimated at $3,972,051, approximately $491 per square foot. 9701 Bellasera Cir is a home located in Horry County with nearby schools including Myrtle Beach Child Development Center, Myrtle Beach Elementary School, and Myrtle Beach Primary School.
Ownership History
Date
Name
Owned For
Owner Type
Purchase Details
Closed on
Jan 11, 2024
Sold by
Audi George J
Bought by
Sheffer Scott B and Sheffer Rosanna D
Current Estimated Value
Home Financials for this Owner
Home Financials are based on the most recent Mortgage that was taken out on this home.
Original Mortgage
$2,700,000
Outstanding Balance
$2,653,196
Interest Rate
7%
Mortgage Type
New Conventional
Estimated Equity
$1,318,855
Purchase Details
Closed on
Sep 27, 2018
Sold by
Brown Steven C
Bought by
Audi George J and Audi Christina M
Home Financials for this Owner
Home Financials are based on the most recent Mortgage that was taken out on this home.
Original Mortgage
$1,960,000
Interest Rate
4.25%
Mortgage Type
New Conventional
Purchase Details
Closed on
May 20, 2011
Sold by
Grande Dunes Development Company Llc
Bought by
Brown Steven C
Create a Home Valuation Report for This Property
The Home Valuation Report is an in-depth analysis detailing your home's value as well as a comparison with similar homes in the area
Home Values in the Area
Average Home Value in this Area
Purchase History
| Date | Buyer | Sale Price | Title Company |
|---|---|---|---|
| Sheffer Scott B | $4,400,000 | -- | |
| Audi George J | $2,800,000 | -- | |
| Brown Steven C | $718,000 | -- |
Source: Public Records
Mortgage History
| Date | Status | Borrower | Loan Amount |
|---|---|---|---|
| Open | Sheffer Scott B | $2,700,000 | |
| Previous Owner | Audi George J | $1,960,000 |
Source: Public Records
Tax History Compared to Growth
Tax History
| Year | Tax Paid | Tax Assessment Tax Assessment Total Assessment is a certain percentage of the fair market value that is determined by local assessors to be the total taxable value of land and additions on the property. | Land | Improvement |
|---|---|---|---|---|
| 2024 | $68,543 | $252,612 | $77,514 | $175,098 |
| 2023 | $10,975 | $115,413 | $17,121 | $98,292 |
| 2021 | $10,629 | $115,413 | $17,121 | $98,292 |
| 2020 | $9,186 | $115,413 | $17,121 | $98,292 |
| 2019 | $8,840 | $115,413 | $17,121 | $98,292 |
| 2018 | $29,013 | $72,715 | $13,095 | $59,620 |
| 2017 | $5,556 | $109,073 | $19,643 | $89,430 |
| 2016 | -- | $109,073 | $19,643 | $89,430 |
| 2015 | $5,345 | $105,911 | $19,643 | $86,268 |
| 2014 | $4,816 | $105,911 | $19,643 | $86,268 |
Source: Public Records
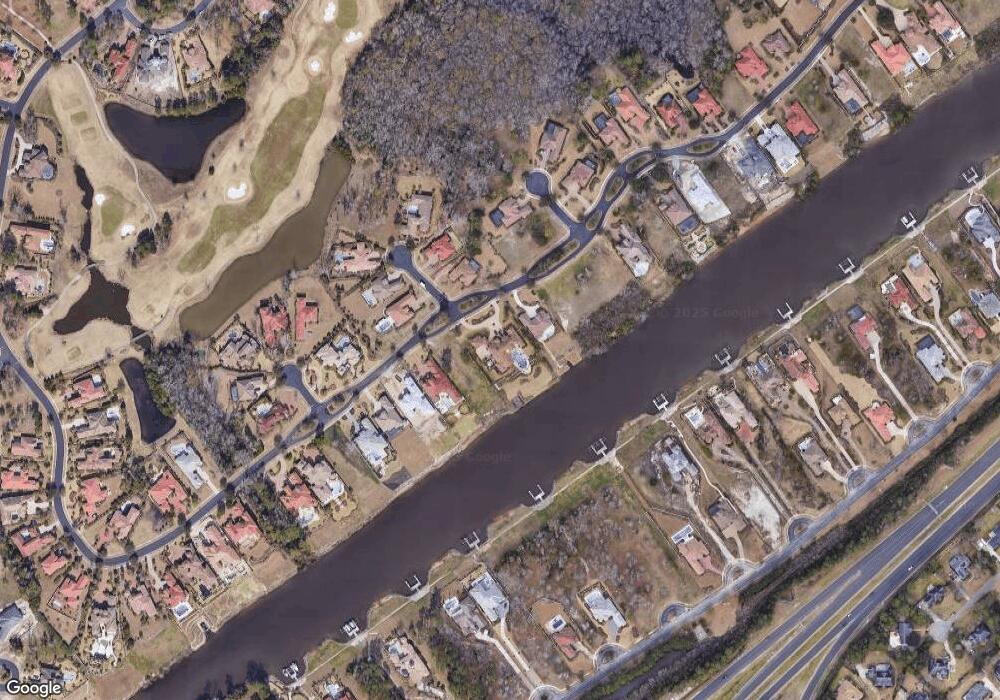
Map
Nearby Homes
- 9675 Ravello Ct
- 9765 Ravello Ct
- 9684 Ravello Ct
- 9185 Marina Pkwy
- 9235 Marina Pkwy Unit GRANDE DUNES BAL HAR
- 9243 Marina Pkwy
- 9329 Marina Pkwy
- 9237 Bellasera Cir
- 9285 Bellasera Cir
- 9325 Cove Dr
- 9891 Bellasera Cir
- 9485 Ronda Ct
- 9318 Cove Dr
- 9305 Cove Dr
- 1501 Serena Dr
- 9107 Marina Pkwy
- 0 Charleston Ct Unit Lot 2 Dunes Cove
- 0 Charleston Ct Unit Lot 2 Charleston Ct.
- 9400 Lake Dr
- 1330 Villa Marbella Ct Unit 303
- 9701 Bellasera Cir Unit 72 Members Club
- 9701 Bellasera Cir Unit Lot 72/73
- 9721 Bellasera Cir Unit 73 Members Club
- 9691 Bellasera Cir Unit 71 Members Club
- 9691 Bellasera Cir Unit Lot 71 Members Club
- 9685 Bellasera Cir Unit 70 Members Club
- 9731 Bellasera Cir Unit 74 Members Club
- 9730 Catalonia Ct
- 9730 Catalonia Ct Unit 113 Members Club
- 9730 Catalonia Ct Unit Lot 113 Members Clu
- 9741 Bellasera Cir Unit 75 Members Club
- 9679 Bellasera Cir Unit 69 Members Club
- 9679 Bellasera Cir Unit Lot 69 Members Club
- 9675 Ravello Ct Unit 114 Members Club
- 9675 Ravello Ct Unit MEMBERS CLUB @ GRAND
- 9675 Ravello Ct Unit Lot 114 Members Clu
- 9734 Catalonia Ct Unit 112 Members Club
- 9734 Catalonia Ct
- 9729 Catalonia Ct
- 9671 Bellasera Cir Unit 68 Members Club