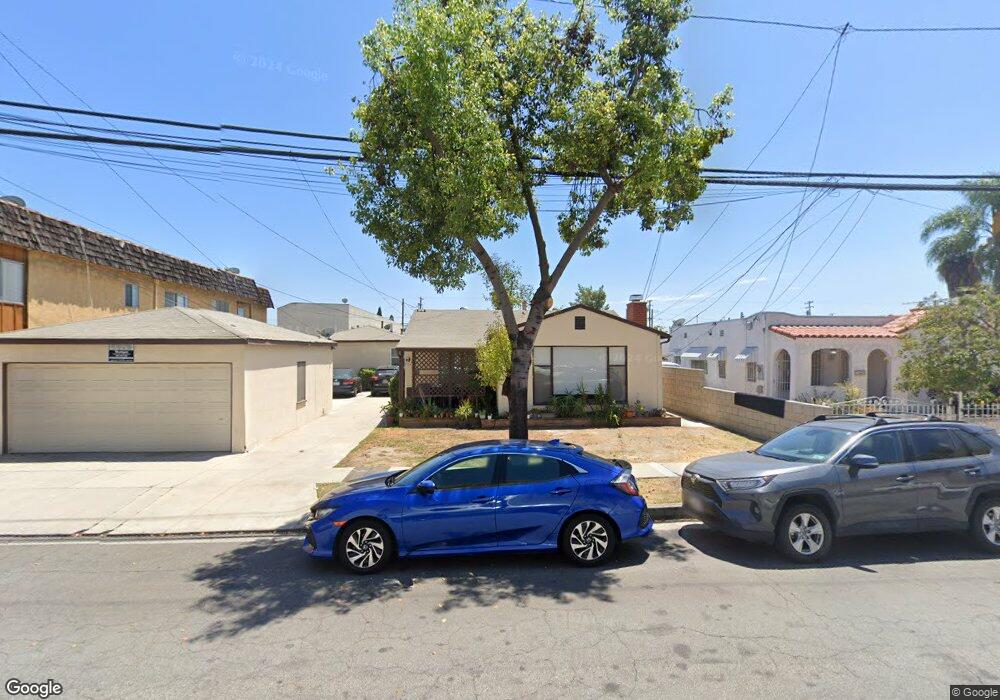
9702 Beverly St Bellflower, CA 90706
Estimated Value: $800,000
6
Beds
5
Baths
2,989
Sq Ft
$268/Sq Ft
Est. Value
About This Home
This home is located at 9702 Beverly St, Bellflower, CA 90706 and is currently estimated at $800,000, approximately $267 per square foot. 9702 Beverly St is a home with nearby schools including Mayfair High School and St. Bernard School.
Ownership History
Date
Name
Owned For
Owner Type
Purchase Details
Closed on
Oct 2, 2018
Sold by
Stacker Patrick C and Hagopian Children Family Trust
Bought by
Roberts Sabrina Ann and Terry L Hagopian Family Trust
Current Estimated Value
Home Financials for this Owner
Home Financials are based on the most recent Mortgage that was taken out on this home.
Original Mortgage
$450,000
Outstanding Balance
$393,262
Interest Rate
4.6%
Mortgage Type
Commercial
Estimated Equity
$406,738
Purchase Details
Closed on
Jun 12, 2017
Sold by
Oldham Alice
Bought by
Roberts Sabrina Ann and Terry L Hagopian Family Trust
Purchase Details
Closed on
Dec 21, 2013
Sold by
Phares Bobby Richard
Bought by
Stacker Patrick C and Hagopian Children Family Trust
Purchase Details
Closed on
Nov 11, 2012
Sold by
Hagopian Maria and The Jack & Maria Hagopian 1999
Bought by
Phares Bobby Richard
Purchase Details
Closed on
Apr 21, 1999
Sold by
Hagopian Jack and Hagopian Maria E
Bought by
Hagopian Jack and Hagopian Maria E
Create a Home Valuation Report for This Property
The Home Valuation Report is an in-depth analysis detailing your home's value as well as a comparison with similar homes in the area
Home Values in the Area
Average Home Value in this Area
Purchase History
| Date | Buyer | Sale Price | Title Company |
|---|---|---|---|
| Roberts Sabrina Ann | -- | First American Title Company | |
| Roberts Sabrina Ann | -- | None Available | |
| Stacker Patrick C | -- | None Available | |
| Phares Bobby Richard | -- | None Available | |
| Hagopian Jack | -- | -- |
Source: Public Records
Mortgage History
| Date | Status | Borrower | Loan Amount |
|---|---|---|---|
| Open | Roberts Sabrina Ann | $450,000 |
Source: Public Records
Tax History Compared to Growth
Tax History
| Year | Tax Paid | Tax Assessment Tax Assessment Total Assessment is a certain percentage of the fair market value that is determined by local assessors to be the total taxable value of land and additions on the property. | Land | Improvement |
|---|---|---|---|---|
| 2025 | $7,303 | $502,531 | $202,026 | $300,505 |
| 2024 | $7,303 | $492,678 | $198,065 | $294,613 |
| 2023 | $7,049 | $483,019 | $194,182 | $288,837 |
| 2022 | $6,933 | $473,549 | $190,375 | $283,174 |
| 2021 | $6,794 | $464,265 | $186,643 | $277,622 |
| 2020 | $6,753 | $460,166 | $184,730 | $275,436 |
| 2019 | $6,647 | $898,905 | $375,513 | $523,392 |
| 2018 | $9,431 | $720,332 | $293,303 | $427,029 |
| 2016 | $7,380 | $542,759 | $227,992 | $314,767 |
| 2015 | $7,237 | $534,607 | $224,568 | $310,039 |
| 2014 | $7,164 | $495,786 | $208,830 | $286,956 |
Source: Public Records
Map
Nearby Homes
- 9833 Palm St
- 9713 Cedar St
- 9929 Park St
- 9833 Walnut St
- 9513 Cedar St
- 16821 Ardmore Ave
- 9928 Cedar St
- 9924 Cedar St
- 17046 Clark Ave
- 10117 Palm St
- 16712 Bellflower Blvd
- 5549 Ashworth St
- 9235 Artesia Blvd Unit 5
- 9719 Belmont St
- 6168 Briercrest Ave
- 9716 Oak St
- 6118 Amos Ave
- 17458 Deerfield Ave
- 5134 Ashworth St
- 6127 Adenmoor Ave
- 9646 Beverly St
- 9642 Beverly St
- 9638 Beverly St
- 9714 Beverly St
- 9720 Beverly St
- 9732 Beverly St Unit 9732
- 9628 Beverly St
- 9631 Artesia Blvd
- 9726 Beverly St
- 9627 Artesia Blvd
- 9622 Beverly St
- 9730 Beverly St
- 9614 Beverly St
- 9613 Artesia Blvd
- 9714 Artesia Blvd
- 9714 Artesia Blvd
- 17302 Ardmore Ave
- 17314 Ardmore Ave
- 9720 Artesia Blvd
- 9719 Beach St