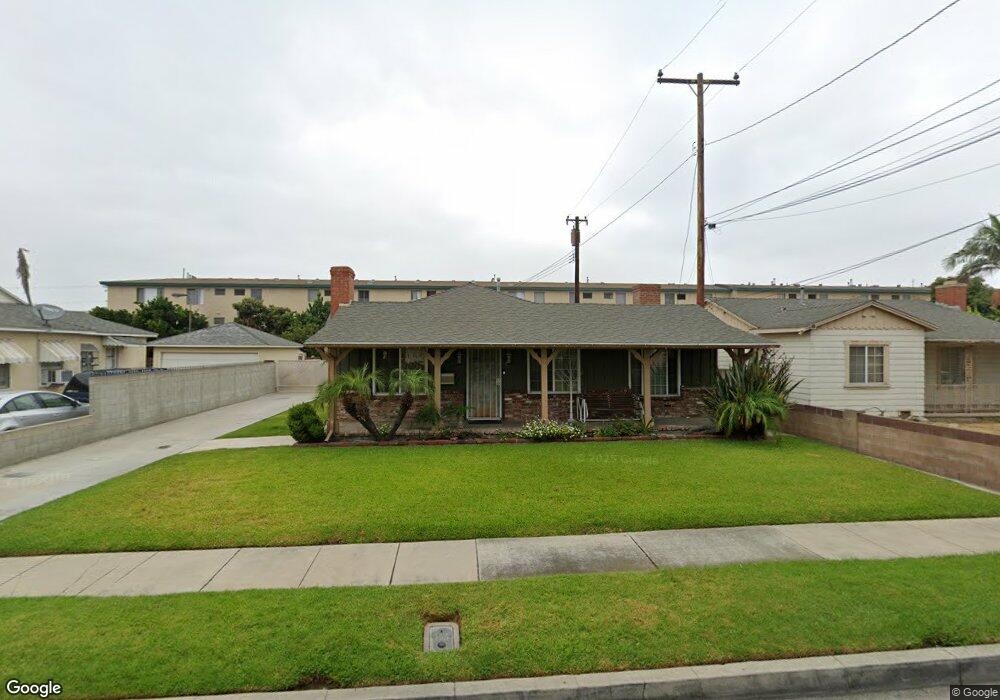
9703 Maple St Bellflower, CA 90706
Estimated Value: $837,000 - $971,000
3
Beds
2
Baths
1,914
Sq Ft
$474/Sq Ft
Est. Value
About This Home
This home is located at 9703 Maple St, Bellflower, CA 90706 and is currently estimated at $907,703, approximately $474 per square foot. 9703 Maple St is a home located in Los Angeles County with nearby schools including Thomas Jefferson Elementary School, Mayfair High School, and St. Bernard School.
Ownership History
Date
Name
Owned For
Owner Type
Purchase Details
Closed on
May 26, 2005
Sold by
Thomas Robert L
Bought by
Evans Chantay
Current Estimated Value
Home Financials for this Owner
Home Financials are based on the most recent Mortgage that was taken out on this home.
Original Mortgage
$486,000
Outstanding Balance
$273,466
Interest Rate
6.99%
Mortgage Type
Purchase Money Mortgage
Estimated Equity
$634,237
Purchase Details
Closed on
Jan 15, 1999
Sold by
Sprague Steven L
Bought by
Thomas Robert L and Thomas Shaunna
Home Financials for this Owner
Home Financials are based on the most recent Mortgage that was taken out on this home.
Original Mortgage
$208,487
Interest Rate
6.78%
Mortgage Type
FHA
Create a Home Valuation Report for This Property
The Home Valuation Report is an in-depth analysis detailing your home's value as well as a comparison with similar homes in the area
Home Values in the Area
Average Home Value in this Area
Purchase History
| Date | Buyer | Sale Price | Title Company |
|---|---|---|---|
| Evans Chantay | $540,000 | First American Title | |
| Thomas Robert L | $210,000 | North American Title Co | |
| Sprague Steven Lamar | $3,000 | North American Title Co |
Source: Public Records
Mortgage History
| Date | Status | Borrower | Loan Amount |
|---|---|---|---|
| Open | Evans Chantay | $486,000 | |
| Previous Owner | Thomas Robert L | $208,487 |
Source: Public Records
Tax History
| Year | Tax Paid | Tax Assessment Tax Assessment Total Assessment is a certain percentage of the fair market value that is determined by local assessors to be the total taxable value of land and additions on the property. | Land | Improvement |
|---|---|---|---|---|
| 2025 | $8,699 | $737,938 | $557,695 | $180,243 |
| 2024 | $8,699 | $723,469 | $546,760 | $176,709 |
| 2023 | $8,344 | $709,285 | $536,040 | $173,245 |
| 2022 | $8,194 | $695,379 | $525,530 | $169,849 |
| 2021 | $8,023 | $681,745 | $515,226 | $166,519 |
| 2019 | $6,641 | $555,000 | $419,000 | $136,000 |
| 2018 | $6,496 | $555,000 | $419,000 | $136,000 |
| 2016 | $5,521 | $469,000 | $354,000 | $115,000 |
| 2015 | $5,220 | $445,000 | $336,000 | $109,000 |
| 2014 | $5,243 | $445,000 | $336,000 | $109,000 |
Source: Public Records
Map
Nearby Homes
- 16822 Ardmore Ave
- 16919 Ardmore Ave
- 9559 Flower St
- 9545 Flower St
- 9929 Park St
- 17100 Apple Ave
- 9601 Mayne St
- 17046 Clark Ave
- 9520 Mayne St
- 9921 Flora Vista St Unit 5
- 9921 Flora Vista St Unit 6
- 16401 Clark Ave
- 9527 Los Angeles St
- 16331 Cornuta Ave Unit E
- 16414 Cornuta Ave Unit 8
- 10117 Palm St
- 9548 Alondra Blvd
- 9240 Palm St
- 15751 Blaine Ave
- 9235 Artesia Blvd Unit 5
Your Personal Tour Guide
Ask me questions while you tour the home.