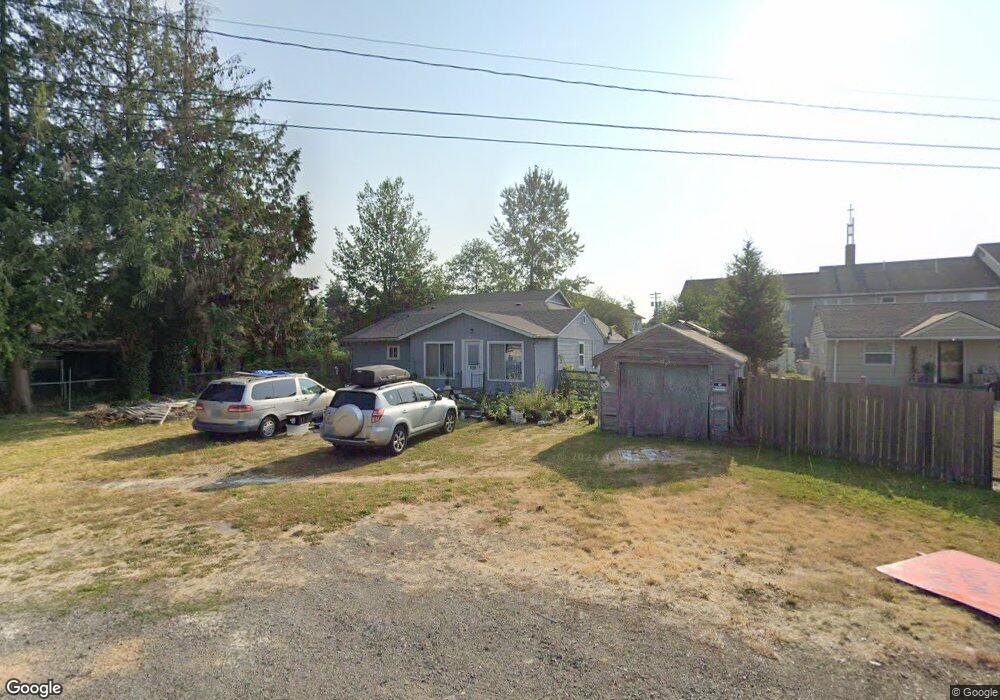
9705 Aqueduct Dr E Tacoma, WA 98445
Midland NeighborhoodEstimated Value: $465,412 - $512,000
3
Beds
2
Baths
1,774
Sq Ft
$272/Sq Ft
Est. Value
About This Home
This home is located at 9705 Aqueduct Dr E, Tacoma, WA 98445 and is currently estimated at $482,853, approximately $272 per square foot. 9705 Aqueduct Dr E is a home located in Pierce County with nearby schools including Larchmont Elementary School, Baker Middle School, and Mount Tahoma High School.
Ownership History
Date
Name
Owned For
Owner Type
Purchase Details
Closed on
Jul 1, 1998
Sold by
Mosher James F
Bought by
Ray Teresa Ann
Current Estimated Value
Home Financials for this Owner
Home Financials are based on the most recent Mortgage that was taken out on this home.
Original Mortgage
$92,800
Outstanding Balance
$22,167
Interest Rate
8.9%
Estimated Equity
$460,686
Purchase Details
Closed on
Jun 6, 1998
Sold by
Ray Jeffrey Allen
Bought by
Ray Teresa Ann
Home Financials for this Owner
Home Financials are based on the most recent Mortgage that was taken out on this home.
Original Mortgage
$92,800
Outstanding Balance
$22,167
Interest Rate
8.9%
Estimated Equity
$460,686
Create a Home Valuation Report for This Property
The Home Valuation Report is an in-depth analysis detailing your home's value as well as a comparison with similar homes in the area
Home Values in the Area
Average Home Value in this Area
Purchase History
| Date | Buyer | Sale Price | Title Company |
|---|---|---|---|
| Ray Teresa Ann | -- | First American Title | |
| Ray Teresa Ann | -- | -- |
Source: Public Records
Mortgage History
| Date | Status | Borrower | Loan Amount |
|---|---|---|---|
| Open | Ray Teresa Ann | $92,800 |
Source: Public Records
Tax History Compared to Growth
Tax History
| Year | Tax Paid | Tax Assessment Tax Assessment Total Assessment is a certain percentage of the fair market value that is determined by local assessors to be the total taxable value of land and additions on the property. | Land | Improvement |
|---|---|---|---|---|
| 2025 | $797 | $469,000 | $205,000 | $264,000 |
| 2024 | $797 | $480,700 | $207,100 | $273,600 |
| 2023 | $797 | $444,800 | $198,700 | $246,100 |
| 2022 | $1,578 | $460,300 | $194,600 | $265,700 |
| 2021 | $1,721 | $326,000 | $127,600 | $198,400 |
| 2019 | $3,655 | $301,000 | $109,200 | $191,800 |
| 2018 | $3,597 | $267,900 | $88,700 | $179,200 |
| 2017 | $3,175 | $221,000 | $69,200 | $151,800 |
| 2016 | $2,826 | $167,900 | $52,200 | $115,700 |
| 2014 | $2,393 | $156,100 | $50,700 | $105,400 |
| 2013 | $2,393 | $136,200 | $43,000 | $93,200 |
Source: Public Records
Map
Nearby Homes