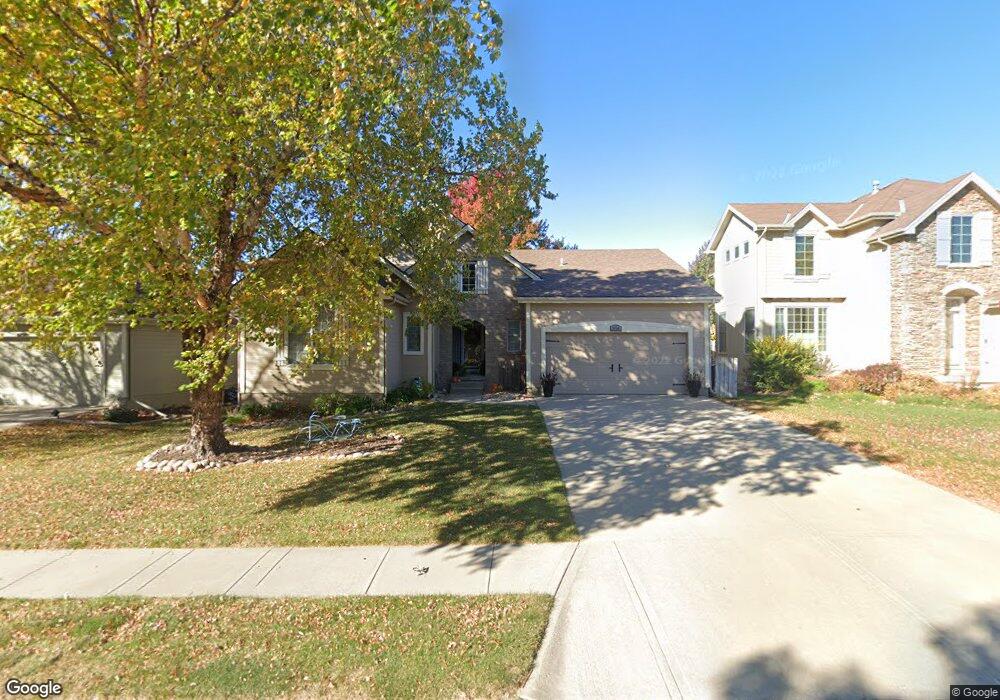
9706 S 27th Ave Bellevue, NE 68123
Estimated Value: $321,000 - $355,000
2
Beds
2
Baths
1,797
Sq Ft
$191/Sq Ft
Est. Value
About This Home
This home is located at 9706 S 27th Ave, Bellevue, NE 68123 and is currently estimated at $342,841, approximately $190 per square foot. 9706 S 27th Ave is a home located in Sarpy County with nearby schools including Chandler View Elementary School, Bryan Middle School, and Bryan High School.
Ownership History
Date
Name
Owned For
Owner Type
Purchase Details
Closed on
Oct 5, 2009
Sold by
Federal Home Loan Mortgage Corporation
Bought by
Paul Brenda K
Current Estimated Value
Home Financials for this Owner
Home Financials are based on the most recent Mortgage that was taken out on this home.
Original Mortgage
$162,011
Outstanding Balance
$105,899
Interest Rate
5.1%
Estimated Equity
$236,942
Purchase Details
Closed on
Apr 6, 2009
Sold by
Kudrna Joyce L and Kudrna Larry L
Bought by
Federal Home Loan Mortgage Corp
Purchase Details
Closed on
Jul 7, 2003
Sold by
Benchmark Homes Inc
Bought by
Kudrna Larry L and Kudrna Joyce L
Home Financials for this Owner
Home Financials are based on the most recent Mortgage that was taken out on this home.
Original Mortgage
$182,970
Interest Rate
4.62%
Create a Home Valuation Report for This Property
The Home Valuation Report is an in-depth analysis detailing your home's value as well as a comparison with similar homes in the area
Home Values in the Area
Average Home Value in this Area
Purchase History
| Date | Buyer | Sale Price | Title Company |
|---|---|---|---|
| Paul Brenda K | -- | Multiple | |
| Federal Home Loan Mortgage Corp | $185,000 | None Available | |
| Kudrna Larry L | $193,000 | -- |
Source: Public Records
Mortgage History
| Date | Status | Borrower | Loan Amount |
|---|---|---|---|
| Open | Paul Brenda K | $162,011 | |
| Previous Owner | Kudrna Larry L | $182,970 |
Source: Public Records
Tax History Compared to Growth
Tax History
| Year | Tax Paid | Tax Assessment Tax Assessment Total Assessment is a certain percentage of the fair market value that is determined by local assessors to be the total taxable value of land and additions on the property. | Land | Improvement |
|---|---|---|---|---|
| 2025 | $4,836 | $305,675 | $50,000 | $255,675 |
| 2024 | $6,114 | $289,046 | $50,000 | $239,046 |
| 2023 | $6,114 | $283,227 | $45,000 | $238,227 |
| 2022 | $5,541 | $253,834 | $40,000 | $213,834 |
| 2021 | $5,206 | $236,932 | $37,000 | $199,932 |
| 2020 | $4,944 | $223,539 | $37,000 | $186,539 |
| 2019 | $4,925 | $212,322 | $37,000 | $175,322 |
| 2018 | $4,760 | $203,838 | $37,000 | $166,838 |
| 2017 | $4,631 | $197,065 | $28,000 | $169,065 |
| 2016 | $4,384 | $188,291 | $28,000 | $160,291 |
| 2015 | $4,177 | $183,371 | $28,000 | $155,371 |
| 2014 | $4,141 | $183,211 | $28,000 | $155,211 |
| 2012 | -- | $181,070 | $28,000 | $153,070 |
Source: Public Records
Map
Nearby Homes
- 9605 S 27th St
- 9608 S 26th Ave
- 9808 S 28th Avenue Cir
- 9513 S 26th Ave
- 2601 Calvin St
- 2616 Tulip Ln
- 9607 S 24th St
- 2303 Lola Ave
- 2618 Geri Dr
- 2616 Rose Lane Rd
- 2116 Gindy Dr
- 8954 S 21st St
- 2605 Virginia St
- 8706 S 23rd St
- 8711 S 23rd St
- 10808 Lewis And Clark Rd
- 2021 Gindy Cir
- 8688 S 23rd St
- 2201 Citta Cir
- 2026 Concord Cir
- 9704 S 27th Ave
- 9708 S 27th Ave
- 9702 S 27th Ave
- 9802 S 27th Ave
- 9705 S 28th St
- 9707 S 28th St
- 9703 S 28th St
- 9801 S 28th St
- 9703 S 27th Ave
- 9608 S 27th Ave
- 9804 S 27th Ave
- 9701 S 28th St
- 9701 S 27th Ave
- 2707 Calvin St
- 9803 S 28th St
- 9609 S 27th Ave
- 9607 S 28th St
- 9606 S 27th Ave
- 2705 Calvin St
- 2710 Morrie Dr