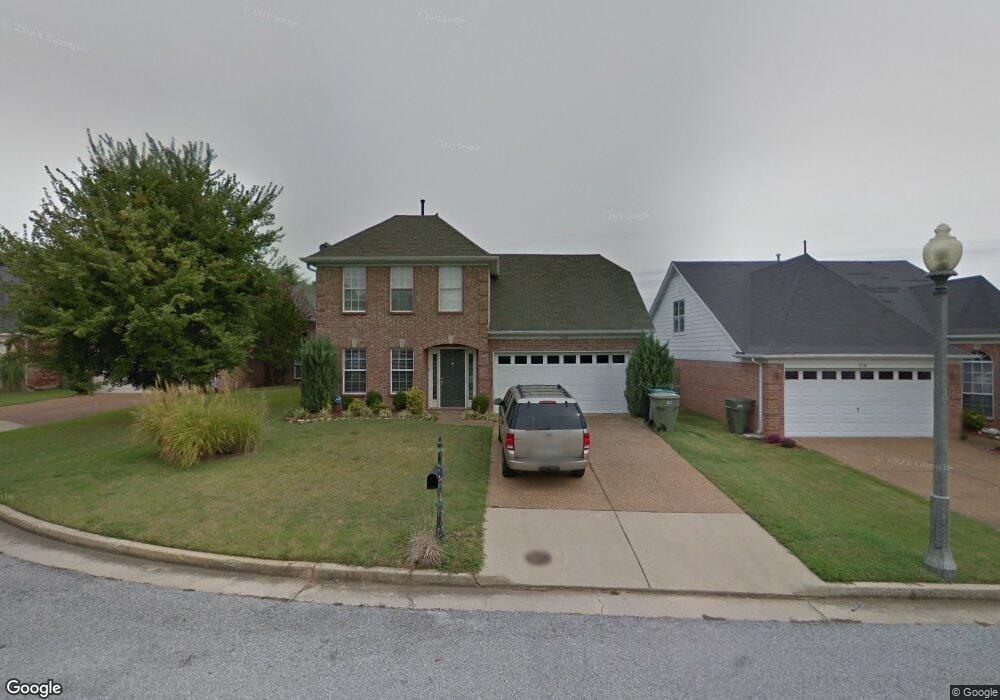
9708 Java Cove Arlington, TN 38002
Cordova NeighborhoodEstimated Value: $242,096 - $272,000
3
Beds
3
Baths
2,162
Sq Ft
$120/Sq Ft
Est. Value
About This Home
This home is located at 9708 Java Cove, Arlington, TN 38002 and is currently estimated at $260,024, approximately $120 per square foot. 9708 Java Cove is a home located in Shelby County with nearby schools including Chimneyrock Elementary School, Cordova High School, and Kate Bond Middle School.
Ownership History
Date
Name
Owned For
Owner Type
Purchase Details
Closed on
Jun 7, 2024
Sold by
Bohline David L
Bought by
David Bohline Living Trust and Bohline
Current Estimated Value
Purchase Details
Closed on
Feb 4, 2021
Sold by
Bohline David L and Bohline Joyce E
Bought by
Bohline David L
Purchase Details
Closed on
Oct 27, 2011
Sold by
David & Rebecca Corporation
Bought by
Bohline David L and The Joyce E Bohline Revocable Living Tru
Purchase Details
Closed on
Jul 26, 2011
Sold by
Fannie Mae
Bought by
David & Rebecca Corporation
Purchase Details
Closed on
May 19, 2011
Sold by
Carr Joseph R and Carr Sherrie R
Bought by
Federal National Mortgage Association
Purchase Details
Closed on
Nov 7, 2003
Sold by
Perennial Building Group Llc
Bought by
Carr Joseph R and Carr Sherrie R
Home Financials for this Owner
Home Financials are based on the most recent Mortgage that was taken out on this home.
Original Mortgage
$140,687
Interest Rate
5.75%
Mortgage Type
Unknown
Create a Home Valuation Report for This Property
The Home Valuation Report is an in-depth analysis detailing your home's value as well as a comparison with similar homes in the area
Home Values in the Area
Average Home Value in this Area
Purchase History
| Date | Buyer | Sale Price | Title Company |
|---|---|---|---|
| David Bohline Living Trust | -- | None Listed On Document | |
| Bohline David L | -- | None Available | |
| Bohline David L | $135,000 | Multiple | |
| David & Rebecca Corporation | $76,000 | None Available | |
| Federal National Mortgage Association | $135,948 | None Available | |
| Carr Joseph R | $148,092 | -- |
Source: Public Records
Mortgage History
| Date | Status | Borrower | Loan Amount |
|---|---|---|---|
| Previous Owner | Carr Joseph R | $140,687 |
Source: Public Records
Tax History
| Year | Tax Paid | Tax Assessment Tax Assessment Total Assessment is a certain percentage of the fair market value that is determined by local assessors to be the total taxable value of land and additions on the property. | Land | Improvement |
|---|---|---|---|---|
| 2025 | $1,549 | $65,375 | $12,250 | $53,125 |
| 2024 | $1,549 | $45,700 | $7,500 | $38,200 |
| 2023 | $2,784 | $45,700 | $7,500 | $38,200 |
| 2022 | $2,784 | $45,700 | $7,500 | $38,200 |
| 2021 | $2,817 | $45,700 | $7,500 | $38,200 |
| 2020 | $2,476 | $34,175 | $7,500 | $26,675 |
| 2019 | $1,092 | $34,175 | $7,500 | $26,675 |
| 2018 | $1,092 | $34,175 | $7,500 | $26,675 |
| 2017 | $1,118 | $34,175 | $7,500 | $26,675 |
| 2016 | $1,330 | $30,425 | $0 | $0 |
| 2014 | $1,330 | $30,425 | $0 | $0 |
Source: Public Records
Map
Nearby Homes
- 9774 Misty Bay Cove
- 9605 Misty Knoll Dr
- 2808 Eagle Brier Cove
- 9589 Mosswood Ln
- 2630 Davies Plantation Rd
- 9980 Misty Elm Cove
- 2715 Bending Elm Dr
- 10018 Cameron Ridge Trail
- 3097 Shadow Green Ln
- 2652 Misty Woods Cove S
- 9420 Grove Rd
- 2774 Breezy Ridge Trail
- 0000 U S Highway 64
- 10070 U S Highway 64
- 10046 U S Highway 64
- 000 U S Highway 64
- 2628 Morning Grove Dr
- 10117 US 64 Hwy
- 2995 Woodland Ash Cove
- 9399 Woodcutter Cove
- 9704 Java Cove
- 9714 Java Cove
- 2823 Java Dr
- 9700 Java Cove
- 2803 Java Dr
- 9701 Tributary Cove
- 9709 Tributary Cove
- 9713 Tributary Cove
- 9705 Java Cove
- 9697 Tributary Cove
- 9696 Java Cove
- 2818 Java Dr
- 2814 Java Dr
- 2797 Java Dr
- 2810 Java Dr
- 2824 Java Dr
- 9703 Java Cove
- 2806 Java Dr
- 9723 Tributary Ln
- 2791 Java Dr
Your Personal Tour Guide
Ask me questions while you tour the home.