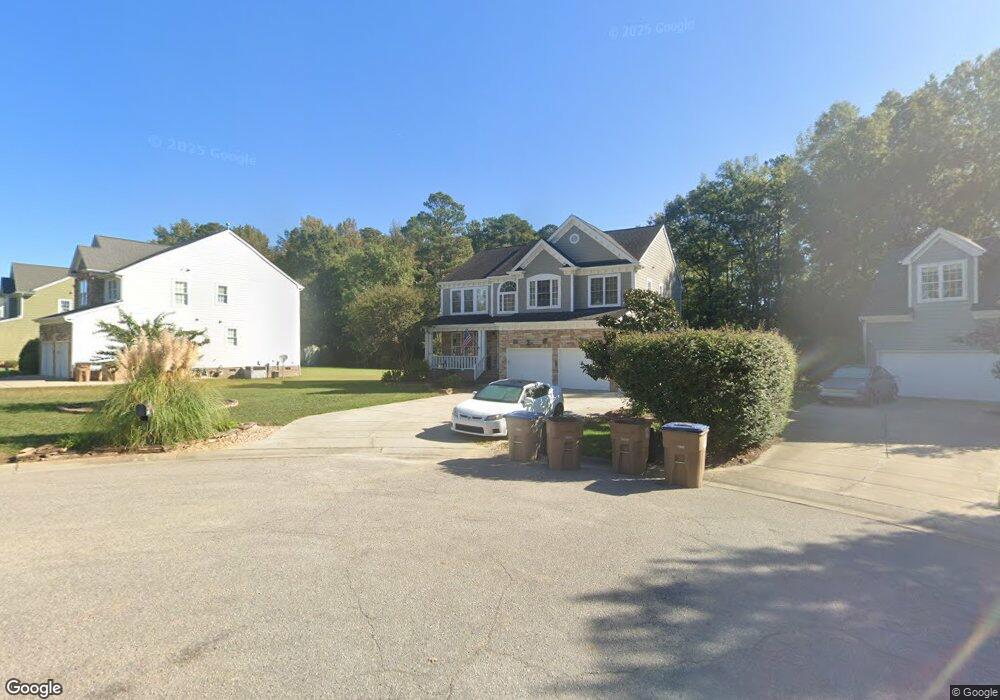
9708 Rainsong St Wake Forest, NC 27587
Estimated Value: $523,000 - $544,000
4
Beds
3
Baths
2,517
Sq Ft
$211/Sq Ft
Est. Value
About This Home
This home is located at 9708 Rainsong St, Wake Forest, NC 27587 and is currently estimated at $531,428, approximately $211 per square foot. 9708 Rainsong St is a home located in Wake County with nearby schools including Sanford Creek Elementary School, Wake Forest-Rolesville Middle School, and Wake Forest High School.
Ownership History
Date
Name
Owned For
Owner Type
Purchase Details
Closed on
Mar 29, 2019
Sold by
Asim Muhammed and Asim Ewa
Bought by
Schmeer David and Finley Lisa
Current Estimated Value
Home Financials for this Owner
Home Financials are based on the most recent Mortgage that was taken out on this home.
Original Mortgage
$263,920
Outstanding Balance
$232,033
Interest Rate
4.3%
Mortgage Type
New Conventional
Estimated Equity
$299,395
Purchase Details
Closed on
Dec 22, 2005
Sold by
Murdock & Gannon Construction Inc
Bought by
Asim Muhammed and Asim Ewa
Purchase Details
Closed on
Sep 7, 2005
Sold by
Shearon Farms Llc
Bought by
Murdock & Gannon Construction Inc
Home Financials for this Owner
Home Financials are based on the most recent Mortgage that was taken out on this home.
Original Mortgage
$215,000
Interest Rate
5.86%
Mortgage Type
Construction
Create a Home Valuation Report for This Property
The Home Valuation Report is an in-depth analysis detailing your home's value as well as a comparison with similar homes in the area
Home Values in the Area
Average Home Value in this Area
Purchase History
| Date | Buyer | Sale Price | Title Company |
|---|---|---|---|
| Schmeer David | $330,000 | None Available | |
| Asim Muhammed | $302,000 | None Available | |
| Murdock & Gannon Construction Inc | $49,500 | None Available |
Source: Public Records
Mortgage History
| Date | Status | Borrower | Loan Amount |
|---|---|---|---|
| Open | Schmeer David | $263,920 | |
| Previous Owner | Murdock & Gannon Construction Inc | $215,000 |
Source: Public Records
Tax History
| Year | Tax Paid | Tax Assessment Tax Assessment Total Assessment is a certain percentage of the fair market value that is determined by local assessors to be the total taxable value of land and additions on the property. | Land | Improvement |
|---|---|---|---|---|
| 2025 | $4,873 | $504,953 | $105,000 | $399,953 |
| 2024 | $4,855 | $504,953 | $105,000 | $399,953 |
Source: Public Records
Map
Nearby Homes
- 4208 Tain Burgh Ct
- 4438 Hillsgrove Rd
- 4205 Ginger Sprout Dr
- 4447 Middletown Dr
- 4509 Middletown Dr
- 8330 Bratt Ave
- 8911 Elizabeth Bennet Place
- 3100 Lariat Ridge Dr
- 2928 Thurman Dairy Loop
- 8857 Thornton Town Place
- 2908 Thurman Dairy Loop
- 3100 Countryman Ct
- 8840 Thornton Town Place
- 8708 Wild Wood Forest Dr
- 8700 Wild Wood Forest Dr
- 3101 Greenville Loop Rd
- 8523 Beckett Chase Way
- 8856 Commons Townes Dr
- 8521 Beckett Chase Way
- 8517 Beckett Chase Way
- 9712 Rainsong Dr
- 9712 Rainsong St
- 9709 Rainsong Dr
- 9709 Rainsong Dr
- 9700 Rainsong Dr
- 9708 Rainsong Dr
- 9713 Rainsong Dr
- 9704 Rainsong Dr
- 9701 Rainsong Dr
- 9705 Rainsong Dr
- 9716 Rainsong Dr
- 9717 Rainsong Dr
- 9721 Rainsong St
- 9721 Rainsong Dr
- 9720 Rainsong Dr
- 9725 Rainsong Dr
- 9700 Clover Bank St
- 9724 Rainsong Dr
- 9704 Clover Bank St
- 9705 Corktree Ct
Your Personal Tour Guide
Ask me questions while you tour the home.