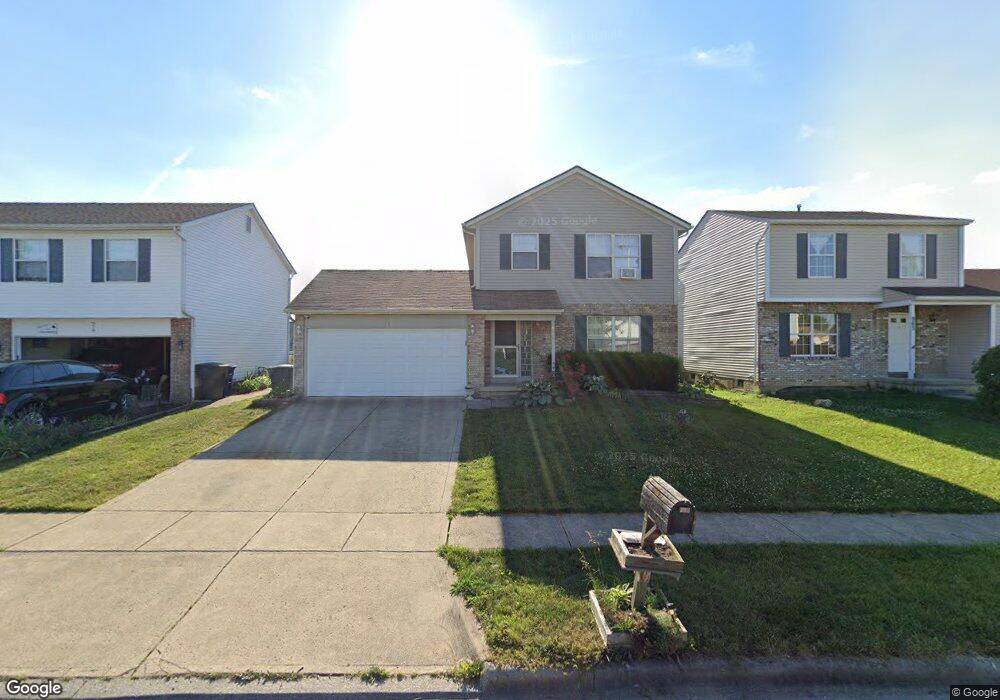
971 Bootman Dr Columbus, OH 43228
Cherry Creek NeighborhoodEstimated Value: $248,000 - $331,000
3
Beds
3
Baths
1,320
Sq Ft
$212/Sq Ft
Est. Value
About This Home
This home is located at 971 Bootman Dr, Columbus, OH 43228 and is currently estimated at $279,952, approximately $212 per square foot. 971 Bootman Dr is a home located in Franklin County with nearby schools including Prairie Norton Elementary School, Holt Crossing Intermediate School, and Pleasant View Middle School.
Ownership History
Date
Name
Owned For
Owner Type
Purchase Details
Closed on
Feb 4, 2009
Sold by
Secretary Of Housing & Urban Development
Bought by
Flores Herbert M
Current Estimated Value
Home Financials for this Owner
Home Financials are based on the most recent Mortgage that was taken out on this home.
Original Mortgage
$91,473
Outstanding Balance
$56,750
Interest Rate
5.08%
Mortgage Type
FHA
Estimated Equity
$223,202
Purchase Details
Closed on
Apr 8, 2008
Sold by
Frye Rodney G and Citimortgage Inc
Bought by
Hud
Purchase Details
Closed on
Dec 9, 1998
Sold by
Waddle Keith A
Bought by
Frye Rodney G and Frye Paula M
Home Financials for this Owner
Home Financials are based on the most recent Mortgage that was taken out on this home.
Original Mortgage
$105,010
Interest Rate
6.96%
Mortgage Type
FHA
Purchase Details
Closed on
Mar 5, 1993
Bought by
Waddle Keith A
Purchase Details
Closed on
May 18, 1992
Create a Home Valuation Report for This Property
The Home Valuation Report is an in-depth analysis detailing your home's value as well as a comparison with similar homes in the area
Home Values in the Area
Average Home Value in this Area
Purchase History
| Date | Buyer | Sale Price | Title Company |
|---|---|---|---|
| Flores Herbert M | $90,000 | Lakeside Ti | |
| Hud | $86,000 | None Available | |
| Frye Rodney G | $105,900 | Title First Agency Inc | |
| Waddle Keith A | $92,100 | -- | |
| -- | $103,300 | -- |
Source: Public Records
Mortgage History
| Date | Status | Borrower | Loan Amount |
|---|---|---|---|
| Open | Flores Herbert M | $91,473 | |
| Previous Owner | Frye Rodney G | $105,010 |
Source: Public Records
Tax History
| Year | Tax Paid | Tax Assessment Tax Assessment Total Assessment is a certain percentage of the fair market value that is determined by local assessors to be the total taxable value of land and additions on the property. | Land | Improvement |
|---|---|---|---|---|
| 2025 | $3,189 | $87,470 | $22,230 | $65,240 |
| 2024 | $3,189 | $87,470 | $22,230 | $65,240 |
| 2023 | $3,133 | $87,465 | $22,225 | $65,240 |
| 2022 | $2,337 | $47,890 | $8,090 | $39,800 |
| 2021 | $2,384 | $47,890 | $8,090 | $39,800 |
| 2020 | $2,371 | $47,890 | $8,090 | $39,800 |
| 2019 | $2,247 | $40,050 | $6,760 | $33,290 |
| 2018 | $2,175 | $40,050 | $6,760 | $33,290 |
| 2017 | $2,226 | $40,050 | $6,760 | $33,290 |
| 2016 | $2,113 | $34,930 | $7,000 | $27,930 |
| 2015 | $2,113 | $34,930 | $7,000 | $27,930 |
| 2014 | $2,115 | $34,930 | $7,000 | $27,930 |
| 2013 | $1,105 | $36,785 | $7,385 | $29,400 |
Source: Public Records
Map
Nearby Homes
- 671 Simbury St
- 621 Simbury St Unit D6
- 557 Simbury St
- 634 Dlyn St Unit 5
- 660 Dlyn St
- 496 Clairbrook Ave Unit Jc-13
- 5656 Idella Dr
- 5584 Brackenridge Ave Unit R7
- 4848 Deephollow Dr
- 443 Clairbrook Ave
- 1086 Oak Bay Dr Unit 1086
- 516 Pamlico St
- 1083 Oak Bay Dr
- 1295 Hathersage Place
- 417 Pamlico St Unit JK2
- 813 Hurlock Ln
- 429 Postle Blvd
- 470 Woodlawn Ave
- 5803 Sundrops Ave
- 495 Daytona Rd
- 963 Bootman Dr
- 985 Bootman Dr
- 5397 Sawatch Dr
- 968 Western Run Dr
- 962 Western Run Dr
- 974 Western Run Dr
- 991 Bootman Dr
- 956 Western Run Dr
- 980 Western Run Dr
- 976 Bootman Dr
- 970 Bootman Dr
- 982 Bootman Dr
- 964 Bootman Dr
- 986 Western Run Dr
- 988 Bootman Dr
- 5400 Wyoming Ln
- 994 Bootman Dr
- 5388 Sawatch Dr
- 992 Western Run Dr
- 5394 Sawatch Dr
Your Personal Tour Guide
Ask me questions while you tour the home.