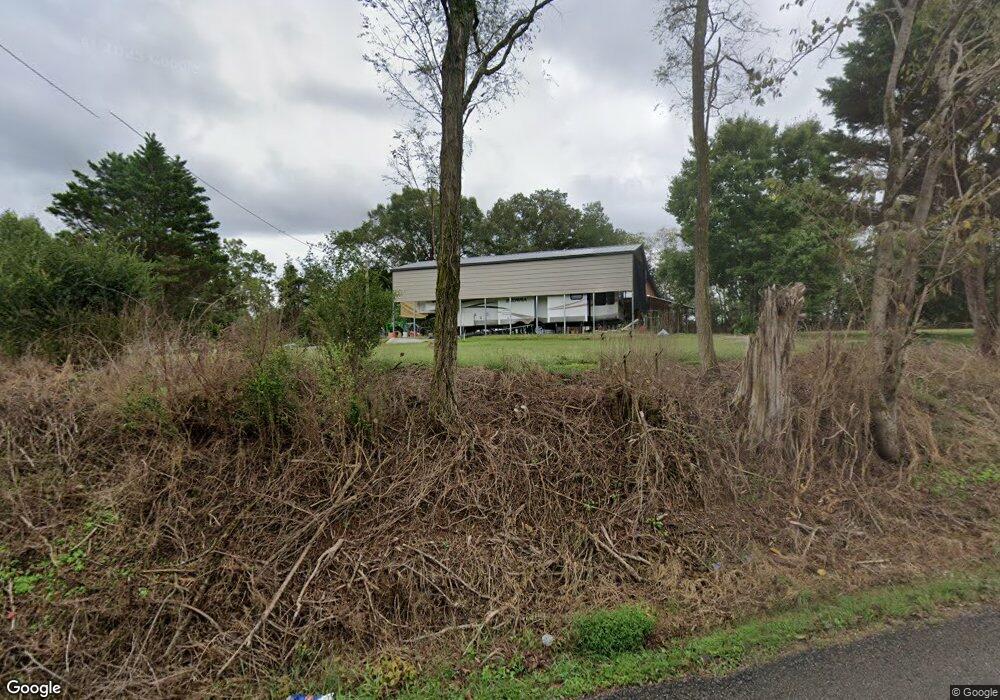
971 James Austin Rd Sparta, TN 38583
Estimated Value: $69,838 - $217,000
--
Bed
1
Bath
748
Sq Ft
$176/Sq Ft
Est. Value
About This Home
This home is located at 971 James Austin Rd, Sparta, TN 38583 and is currently estimated at $131,946, approximately $176 per square foot. 971 James Austin Rd is a home located in White County with nearby schools including Northfield Elementary School, White County Middle School, and White County High School.
Ownership History
Date
Name
Owned For
Owner Type
Purchase Details
Closed on
Jan 27, 2023
Sold by
Goodwin Charles and Goodwin Corliss
Bought by
Howard Johnny and Howard Lacrecia
Current Estimated Value
Purchase Details
Closed on
Aug 25, 2015
Sold by
Butler Melinda K
Bought by
Goodwin Charles and Goodwin Corliss
Purchase Details
Closed on
Dec 12, 2013
Sold by
Butler Bradley A
Bought by
Pirolozzi Melinda K
Purchase Details
Closed on
Aug 21, 2002
Sold by
Noel Tolbert R and Noel Rebecca
Bought by
Pirolozzi Melinda K
Home Financials for this Owner
Home Financials are based on the most recent Mortgage that was taken out on this home.
Original Mortgage
$22,643
Interest Rate
6.49%
Purchase Details
Closed on
Jul 29, 1998
Sold by
Frank Bottoms
Bought by
Noel Tolbert R
Purchase Details
Closed on
Jul 27, 1998
Bought by
Tolbert R Noel
Purchase Details
Closed on
Jul 26, 1988
Bought by
Bottoms Frank and Bottoms Joanne
Purchase Details
Closed on
Nov 18, 1982
Bought by
Austin James
Create a Home Valuation Report for This Property
The Home Valuation Report is an in-depth analysis detailing your home's value as well as a comparison with similar homes in the area
Home Values in the Area
Average Home Value in this Area
Purchase History
| Date | Buyer | Sale Price | Title Company |
|---|---|---|---|
| Howard Johnny | $60,000 | -- | |
| Howard Johnny | $60,000 | None Listed On Document | |
| Goodwin Charles | $30,000 | -- | |
| Pirolozzi Melinda K | $10,000 | -- | |
| Pirolozzi Melinda K | $27,500 | -- | |
| Noel Tolbert R | $20,450 | -- | |
| Tolbert R Noel | $20,500 | -- | |
| Bottoms Frank | $10,000 | -- | |
| Austin James | -- | -- |
Source: Public Records
Mortgage History
| Date | Status | Borrower | Loan Amount |
|---|---|---|---|
| Previous Owner | Austin James | $22,643 |
Source: Public Records
Tax History Compared to Growth
Tax History
| Year | Tax Paid | Tax Assessment Tax Assessment Total Assessment is a certain percentage of the fair market value that is determined by local assessors to be the total taxable value of land and additions on the property. | Land | Improvement |
|---|---|---|---|---|
| 2024 | $251 | $12,250 | $11,350 | $900 |
| 2023 | $0 | $12,250 | $11,350 | $900 |
| 2022 | $216 | $10,550 | $9,650 | $900 |
| 2021 | $216 | $10,550 | $9,650 | $900 |
| 2020 | $216 | $10,550 | $9,650 | $900 |
| 2019 | $159 | $7,775 | $7,075 | $700 |
| 2018 | $159 | $7,775 | $7,075 | $700 |
| 2017 | $159 | $7,775 | $7,075 | $700 |
| 2016 | $159 | $7,775 | $7,075 | $700 |
| 2015 | $146 | $7,875 | $5,000 | $2,875 |
| 2014 | -- | $7,875 | $5,000 | $2,875 |
| 2013 | -- | $7,575 | $5,000 | $2,575 |
Source: Public Records
Map
Nearby Homes
- 768 Milk Plant Rd
- 121 Serenity Dr
- 7 Serenity Dr
- 22 Serenity Dr
- 155 Serenity Dr
- 171 Serenity Dr
- 725 Milk Plant Rd
- 12 Serenity Dr
- 773 James Austin Rd
- 181 Serenity Dr
- 792 James Austin Rd
- 148 Prosperity Dr
- 160 Serenity Dr
- 205 Serenity Dr
- 834 Milk Plant Rd
- 164 Prosperity Dr
- 747 James Austin Rd
- 223 Serenity Dr
- 190 Serenity Dr
- 214 Prosperity Dr