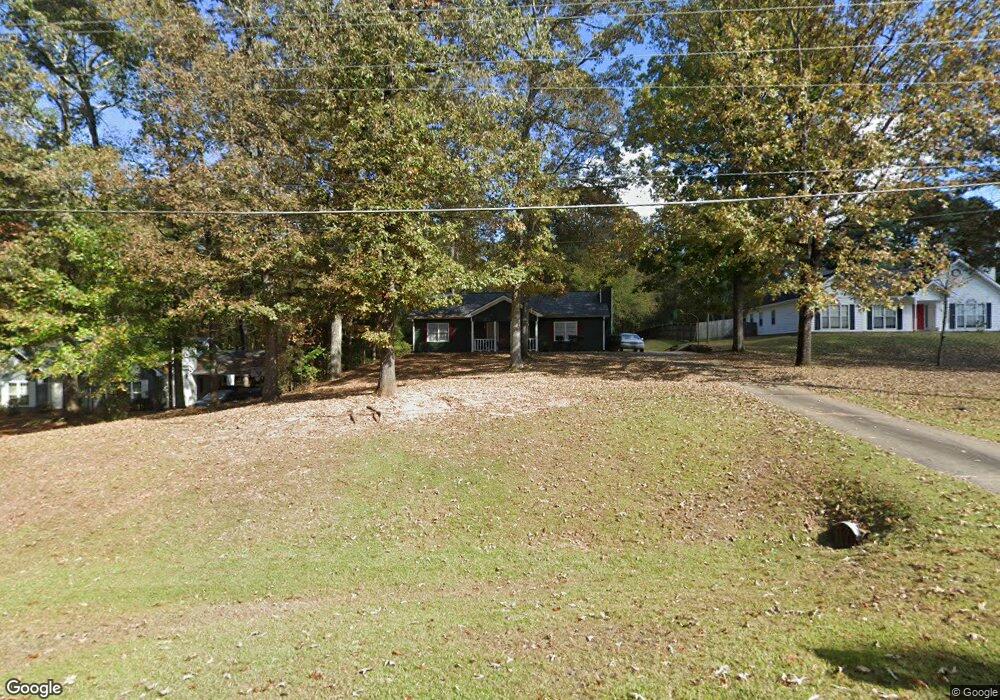
971 Pyne Rd Lagrange, GA 30240
Estimated Value: $197,000 - $241,000
3
Beds
2
Baths
1,431
Sq Ft
$155/Sq Ft
Est. Value
About This Home
This home is located at 971 Pyne Rd, Lagrange, GA 30240 and is currently estimated at $222,393, approximately $155 per square foot. 971 Pyne Rd is a home located in Troup County with nearby schools including Long Cane Elementary School, Berta Weathersbee Elementary School, and Whitesville Road Elementary School.
Ownership History
Date
Name
Owned For
Owner Type
Purchase Details
Closed on
Jun 4, 2021
Sold by
Strozier Michael
Bought by
Blakes David Lee
Current Estimated Value
Home Financials for this Owner
Home Financials are based on the most recent Mortgage that was taken out on this home.
Original Mortgage
$153,174
Outstanding Balance
$137,771
Interest Rate
2.9%
Mortgage Type
FHA
Estimated Equity
$84,622
Purchase Details
Closed on
Aug 14, 2001
Sold by
Dennis Kaleb and Moore Karen M
Bought by
Strozier Michael
Purchase Details
Closed on
Aug 10, 1999
Sold by
Jason C Cottrell
Bought by
Dennis Kaleb and Moore Karen M
Purchase Details
Closed on
Jun 30, 1998
Sold by
Robert Todd Yarbrough
Bought by
Jason C Cottrell
Purchase Details
Closed on
Sep 29, 1992
Sold by
Nix Jackie
Bought by
Robert Todd Yarbrough
Purchase Details
Closed on
Aug 22, 1991
Sold by
Cordell Mrs Frank B
Bought by
Nix Jackie
Create a Home Valuation Report for This Property
The Home Valuation Report is an in-depth analysis detailing your home's value as well as a comparison with similar homes in the area
Purchase History
| Date | Buyer | Sale Price | Title Company |
|---|---|---|---|
| Blakes David Lee | $156,000 | -- | |
| Strozier Michael | $93,900 | -- | |
| Dennis Kaleb | -- | -- | |
| Jason C Cottrell | $87,500 | -- | |
| Robert Todd Yarbrough | $68,500 | -- | |
| Nix Jackie | $36,000 | -- |
Source: Public Records
Mortgage History
| Date | Status | Borrower | Loan Amount |
|---|---|---|---|
| Open | Blakes David Lee | $153,174 |
Source: Public Records
Tax History
| Year | Tax Paid | Tax Assessment Tax Assessment Total Assessment is a certain percentage of the fair market value that is determined by local assessors to be the total taxable value of land and additions on the property. | Land | Improvement |
|---|---|---|---|---|
| 2025 | $1,964 | $72,004 | $4,120 | $67,884 |
| 2024 | $1,659 | $60,836 | $4,120 | $56,716 |
| 2023 | $1,739 | $63,772 | $4,120 | $59,652 |
| 2022 | $1,669 | $59,812 | $4,120 | $55,692 |
| 2021 | $1,248 | $41,396 | $3,280 | $38,116 |
| 2020 | $1,249 | $41,396 | $3,280 | $38,116 |
| 2019 | $1,131 | $37,492 | $3,700 | $33,792 |
| 2018 | $1,038 | $34,428 | $3,700 | $30,728 |
| 2017 | $1,038 | $34,428 | $3,700 | $30,728 |
| 2016 | $1,023 | $33,930 | $3,700 | $30,230 |
| 2015 | $1,025 | $33,930 | $3,700 | $30,230 |
| 2014 | $979 | $32,338 | $3,700 | $28,638 |
| 2013 | -- | $34,664 | $3,700 | $30,964 |
Source: Public Records
Map
Nearby Homes
- 119 Plymouth Dr
- 113 Colonial Ct Unit 100
- 311 Cumberland Dr
- 640 Hudson Rd
- 101 Ivy Springs Dr
- 124 Lincoln Ln
- 112 Foxdale Dr
- 474 Newton Rd
- 135 Planters Ridge Dr
- 40 River Point Dr
- 0 Glass Bridge Rd Unit 10679358
- 4.5 ACRES Whatley Rd N
- 0 Deming St Unit 10550189
- 0 Salem Rd Tract 2 Unit 10675187
- 509 Connie Dr
- 98 Hearn Rd
- 104 Hidden Springs Dr
- 808 S Fling Rd
- 105 Redwood Dr
- 427 Fling Rd
- 961 Pyne Rd
- 981 Pyne Rd
- 949 Pyne Rd
- 143 Plymouth Dr
- 384 Maley Rd
- 0 Maley Rd Unit 10331605
- 0 Maley Rd Unit 20019025
- 0 Maley Rd Unit 8407052
- 0 Maley Rd Unit 8436221
- 0 Maley Rd Unit 16 ac 8644801
- 360 Maley Rd
- 937 Pyne Rd
- 141 Plymouth Dr
- 994 Pyne Rd
- 348 Maley Rd
- 926 Pyne Rd
- 919 Pyne Rd
- 901 Pyne Rd
- 912 Pyne Rd
- 139 Plymouth Dr
Your Personal Tour Guide
Ask me questions while you tour the home.