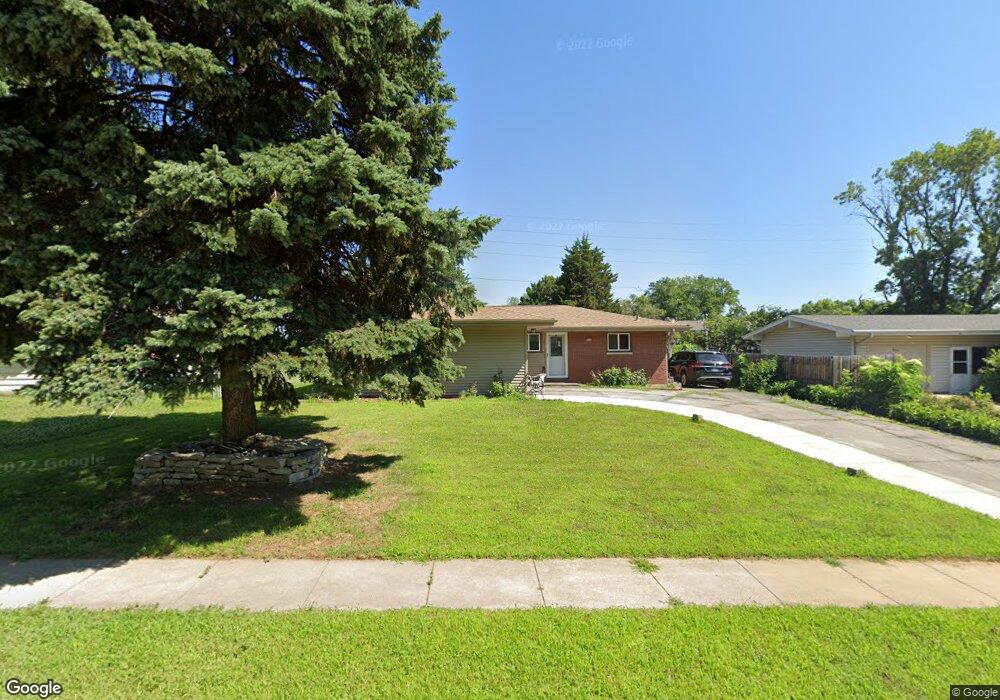
9712 Corby St Omaha, NE 68134
Maple Village NeighborhoodEstimated Value: $261,000 - $276,663
3
Beds
2
Baths
1,993
Sq Ft
$134/Sq Ft
Est. Value
About This Home
This home is located at 9712 Corby St, Omaha, NE 68134 and is currently estimated at $266,166, approximately $133 per square foot. 9712 Corby St is a home located in Douglas County with nearby schools including Edison Elementary School, Beveridge Magnet Middle School, and Burke High School.
Ownership History
Date
Name
Owned For
Owner Type
Purchase Details
Closed on
Oct 21, 2023
Sold by
Taw Po and Taw Ma
Bought by
Kpaw Hay Ta and Taw Snow
Current Estimated Value
Purchase Details
Closed on
Sep 23, 2011
Sold by
Taw Po and Yee Ma
Bought by
Taw Po and Yee Ma
Home Financials for this Owner
Home Financials are based on the most recent Mortgage that was taken out on this home.
Original Mortgage
$99,788
Interest Rate
3.5%
Mortgage Type
FHA
Purchase Details
Closed on
Oct 4, 2009
Sold by
Hicks Robert S and Nuzum Georgia Lee
Bought by
Taw Po and Yee Ma
Home Financials for this Owner
Home Financials are based on the most recent Mortgage that was taken out on this home.
Original Mortgage
$97,200
Interest Rate
7%
Mortgage Type
Adjustable Rate Mortgage/ARM
Purchase Details
Closed on
Jan 27, 1993
Sold by
Hicks Loy J and Hicks Phyllis M
Bought by
Hicks Loy J and Hicks Phyllis M
Create a Home Valuation Report for This Property
The Home Valuation Report is an in-depth analysis detailing your home's value as well as a comparison with similar homes in the area
Home Values in the Area
Average Home Value in this Area
Purchase History
| Date | Buyer | Sale Price | Title Company |
|---|---|---|---|
| Kpaw Hay Ta | -- | None Listed On Document | |
| Taw Po | -- | Midwest Title | |
| Taw Po | $108,000 | Ot | |
| Hicks Loy J | -- | -- |
Source: Public Records
Mortgage History
| Date | Status | Borrower | Loan Amount |
|---|---|---|---|
| Previous Owner | Taw Po | $99,788 | |
| Previous Owner | Taw Po | $97,200 |
Source: Public Records
Tax History Compared to Growth
Tax History
| Year | Tax Paid | Tax Assessment Tax Assessment Total Assessment is a certain percentage of the fair market value that is determined by local assessors to be the total taxable value of land and additions on the property. | Land | Improvement |
|---|---|---|---|---|
| 2025 | $3,506 | $211,600 | $19,500 | $192,100 |
| 2024 | $3,863 | $211,600 | $19,500 | $192,100 |
| 2023 | $3,863 | $183,100 | $19,500 | $163,600 |
| 2022 | $3,326 | $155,800 | $19,500 | $136,300 |
| 2021 | $3,298 | $155,800 | $19,500 | $136,300 |
| 2020 | $2,873 | $134,200 | $19,500 | $114,700 |
| 2019 | $2,882 | $134,200 | $19,500 | $114,700 |
| 2018 | $2,520 | $117,200 | $19,500 | $97,700 |
| 2017 | $2,532 | $117,200 | $19,500 | $97,700 |
| 2016 | $2,279 | $106,200 | $14,700 | $91,500 |
| 2015 | $2,100 | $99,200 | $13,700 | $85,500 |
| 2014 | $2,100 | $99,200 | $13,700 | $85,500 |
Source: Public Records
Map
Nearby Homes
- 9612 Maple St
- 9612 Binney St
- 3213 N 97th St
- 2511 N 98th Ave
- 2505 N 98th Ave
- 10015 Bedford Ave
- 9612 Cady Ave
- 3404 Terrace Dr
- 9482 Spencer St
- 3316 N 101st St
- 9508 Emmet St
- 9342 Corby St
- 9380 Ohio St
- 9911 Pratt St
- 1480 N 96th Ave
- 3854 Parkview Dr
- 9345 Blondo St
- 3818 N 101st St
- 9406 Parker St
- 3906 N 97th St