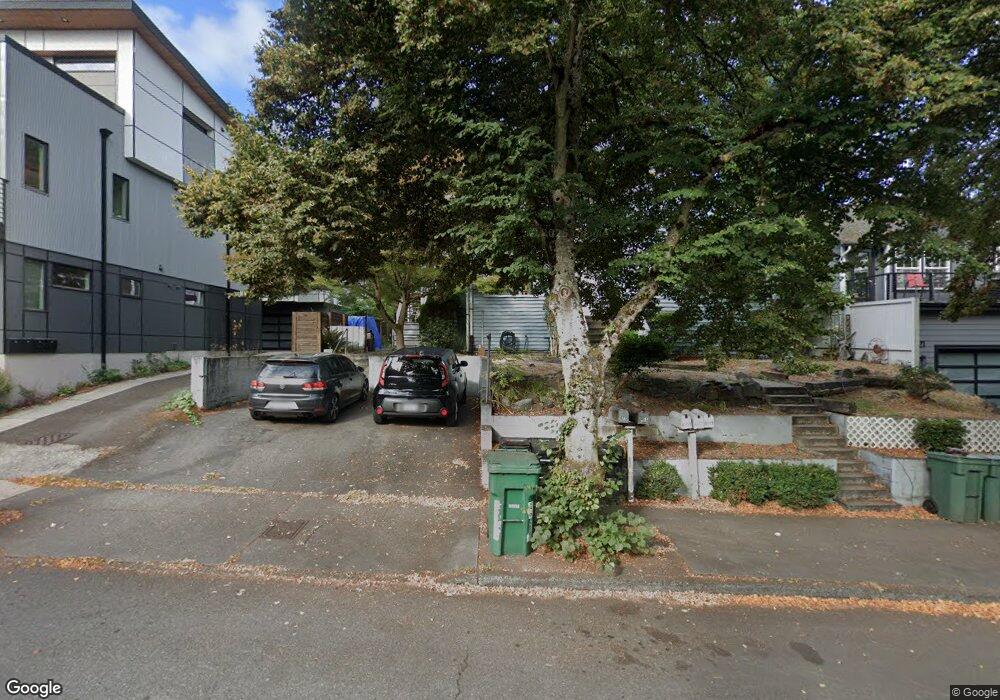
9715 Roosevelt Way NE Seattle, WA 98115
Maple Leaf NeighborhoodEstimated Value: $1,613,000 - $1,827,316
5
Beds
4
Baths
4,383
Sq Ft
$388/Sq Ft
Est. Value
About This Home
This home is located at 9715 Roosevelt Way NE, Seattle, WA 98115 and is currently estimated at $1,699,439, approximately $387 per square foot. 9715 Roosevelt Way NE is a home located in King County with nearby schools including Olympic View Elementary School, Jane Addams Middle School, and Nathan Hale High School.
Ownership History
Date
Name
Owned For
Owner Type
Purchase Details
Closed on
Jul 19, 2003
Sold by
Flanagan Steven D
Bought by
Wilks James R and Wilks Jamie D
Current Estimated Value
Home Financials for this Owner
Home Financials are based on the most recent Mortgage that was taken out on this home.
Original Mortgage
$464,000
Outstanding Balance
$197,715
Interest Rate
5.29%
Estimated Equity
$1,501,724
Purchase Details
Closed on
Jun 9, 1995
Sold by
Connolly John E and Connolly Beverly J
Bought by
Flanagan Steven D
Home Financials for this Owner
Home Financials are based on the most recent Mortgage that was taken out on this home.
Original Mortgage
$156,750
Interest Rate
9%
Purchase Details
Closed on
Feb 20, 1995
Sold by
Lacey Omalley Bond Company
Bought by
Connolly Beverly
Purchase Details
Closed on
Dec 21, 1994
Sold by
Connolly Beverly
Bought by
Lacey Omalley Bond Agency
Create a Home Valuation Report for This Property
The Home Valuation Report is an in-depth analysis detailing your home's value as well as a comparison with similar homes in the area
Home Values in the Area
Average Home Value in this Area
Purchase History
| Date | Buyer | Sale Price | Title Company |
|---|---|---|---|
| Wilks James R | $580,000 | Stewart Title | |
| Flanagan Steven D | $209,000 | Transamerica Title Ins Co | |
| Connolly Beverly | -- | Chicago Title Insurance Co | |
| Lacey Omalley Bond Agency | -- | Chicago Title Insurance Co |
Source: Public Records
Mortgage History
| Date | Status | Borrower | Loan Amount |
|---|---|---|---|
| Open | Wilks James R | $464,000 | |
| Previous Owner | Flanagan Steven D | $156,750 |
Source: Public Records
Tax History Compared to Growth
Tax History
| Year | Tax Paid | Tax Assessment Tax Assessment Total Assessment is a certain percentage of the fair market value that is determined by local assessors to be the total taxable value of land and additions on the property. | Land | Improvement |
|---|---|---|---|---|
| 2024 | $11,956 | $1,202,000 | $957,000 | $245,000 |
| 2023 | $12,472 | $1,286,000 | $861,300 | $424,700 |
| 2022 | $10,918 | $1,246,000 | $765,600 | $480,400 |
| 2021 | $12,234 | $1,153,000 | $765,600 | $387,400 |
| 2020 | $12,307 | $1,240,000 | $765,600 | $474,400 |
| 2018 | $9,030 | $1,088,000 | $701,800 | $386,200 |
| 2017 | $6,926 | $886,000 | $701,800 | $184,200 |
| 2016 | $5,956 | $694,000 | $478,500 | $215,500 |
| 2015 | $5,750 | $579,000 | $446,600 | $132,400 |
| 2014 | -- | $575,000 | $446,600 | $128,400 |
| 2013 | -- | $588,000 | $446,600 | $141,400 |
Source: Public Records
Map
Nearby Homes
- 9701 Roosevelt Way NE
- 1033 NE 98th St
- 1016 NE 95th St
- 9653 7th Ave NE
- 9710 5th Ave NE Unit 503
- 10217 12th Ave NE
- 9222 Roosevelt Way NE Unit 302
- 1261 NE 100th St
- 1257 NE 100th St
- 1244 NE 96th St
- 1255 NE 100th St
- 1522 NE 97th St
- 10303 15th Ave NE
- 1528 NE 97th St
- 1514 NE 95th St
- 9200 5th Ave NE
- 1537 NE 96th St
- 10501 8th Ave NE Unit 115
- 10501 8th Ave NE Unit 334
- 10501 8th Ave NE Unit 406
- 9721 Roosevelt Way NE
- 9709 Roosevelt Way NE
- 9709 Roosevelt Way NE Unit B
- 9709 Roosevelt Way NE Unit A
- 9723 Roosevelt Way NE
- 9711 Roosevelt Way NE Unit B
- 9711 Roosevelt Way NE Unit A
- 849 NE 98th St
- 855 NE 98th St
- 9707 Roosevelt Way NE Unit B
- 9707 Roosevelt Way NE Unit A
- 9725 Roosevelt Way NE
- 9705 Roosevelt Way NE
- 9705 Roosevelt Way NE Unit B
- 9705 Roosevelt Way NE Unit A
- 843 NE 98th St
- 846 NE 97th St
- 852 NE 97th St
- 850 NE 97th St
- 842 NE 97th St