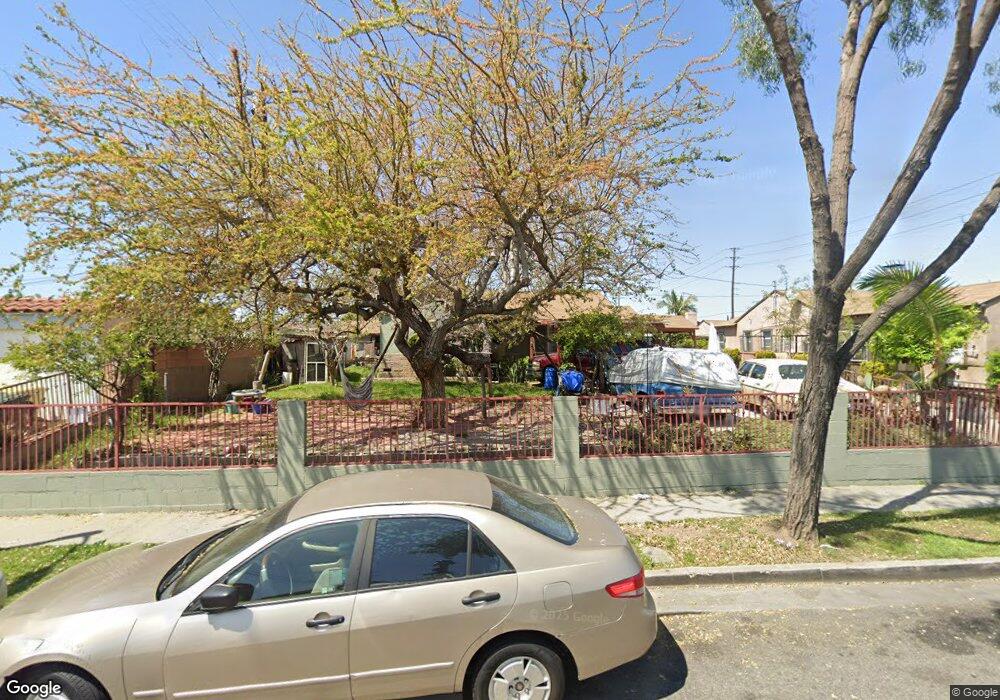
9715 Stanford Ave South Gate, CA 90280
Estimated Value: $779,000 - $899,600
2
Beds
3
Baths
1,553
Sq Ft
$529/Sq Ft
Est. Value
About This Home
This home is located at 9715 Stanford Ave, South Gate, CA 90280 and is currently estimated at $822,150, approximately $529 per square foot. 9715 Stanford Ave is a home located in Los Angeles County with nearby schools including Stanford Avenue Elementary School, Southeast Middle School, and South Gate Middle School.
Ownership History
Date
Name
Owned For
Owner Type
Purchase Details
Closed on
May 20, 2008
Sold by
Cortez Abel
Bought by
Cortez Abel
Current Estimated Value
Home Financials for this Owner
Home Financials are based on the most recent Mortgage that was taken out on this home.
Original Mortgage
$181,000
Outstanding Balance
$114,566
Interest Rate
5.87%
Mortgage Type
New Conventional
Estimated Equity
$707,584
Purchase Details
Closed on
Oct 22, 1993
Sold by
Cortez Abel and Cortez Blanca
Bought by
Cortez Abel
Purchase Details
Closed on
Jul 19, 1993
Sold by
Lobsiger Golda L
Bought by
Cortez Abel and Cortez Blanca
Home Financials for this Owner
Home Financials are based on the most recent Mortgage that was taken out on this home.
Original Mortgage
$161,250
Interest Rate
6.81%
Create a Home Valuation Report for This Property
The Home Valuation Report is an in-depth analysis detailing your home's value as well as a comparison with similar homes in the area
Home Values in the Area
Average Home Value in this Area
Purchase History
| Date | Buyer | Sale Price | Title Company |
|---|---|---|---|
| Cortez Abel | -- | Southland Title Corporation | |
| Cortez Abel | -- | -- | |
| Cortez Abel | $215,000 | Investors Title Company |
Source: Public Records
Mortgage History
| Date | Status | Borrower | Loan Amount |
|---|---|---|---|
| Open | Cortez Abel | $181,000 | |
| Previous Owner | Cortez Abel | $161,250 |
Source: Public Records
Tax History Compared to Growth
Tax History
| Year | Tax Paid | Tax Assessment Tax Assessment Total Assessment is a certain percentage of the fair market value that is determined by local assessors to be the total taxable value of land and additions on the property. | Land | Improvement |
|---|---|---|---|---|
| 2025 | $5,116 | $365,396 | $203,945 | $161,451 |
| 2024 | $5,116 | $358,233 | $199,947 | $158,286 |
| 2023 | $5,031 | $351,210 | $196,027 | $155,183 |
| 2022 | $4,806 | $344,325 | $192,184 | $152,141 |
| 2021 | $4,746 | $337,574 | $188,416 | $149,158 |
| 2020 | $4,777 | $334,414 | $186,485 | $147,929 |
| 2019 | $4,601 | $327,864 | $182,829 | $145,035 |
| 2018 | $4,460 | $321,443 | $179,245 | $142,198 |
| 2016 | $4,256 | $308,675 | $172,286 | $136,389 |
| 2015 | $4,188 | $304,040 | $169,699 | $134,341 |
| 2014 | $4,196 | $298,085 | $166,375 | $131,710 |
Source: Public Records
Map
Nearby Homes
- 2914 Missouri Ave
- 2927 Missouri Ave
- 2905 Kansas Ave
- 9616 Long Beach Blvd
- 9612 Long Beach Blvd
- 3034 Nebraska Ave
- 9320 Long Beach Blvd
- 3130 Kansas Ave
- 2600 Nebraska Ave
- 3175 Ohio Ave
- 2500 Illinois Ave
- 9534 Deeble St
- 10303 Long Beach Blvd
- 8680 Evergreen Ave
- 9621 Laurel St
- 9613 Laurel St
- 10355 Long Beach Blvd
- 8669 Cypress Ave
- 8991 Victoria Ave
- 10430 San Jose Ave
- 9703 Stanford Ave
- 2836 Missouri Ave
- 2849 Indiana Ave
- 2841 Indiana Ave
- 2832 Missouri Ave
- 2837 Indiana Ave
- 2904 Missouri Ave
- 2833 Indiana Ave
- 2828 Missouri Ave
- 2907 Indiana Ave
- 2810 Missouri Ave
- 2910 Missouri Ave
- 2829 Indiana Ave
- 2911 Indiana Ave
- 2824 Missouri Ave
- 2845 Missouri Ave
- 2849 Missouri Ave
- 2841 Missouri Ave
- 2825 Indiana Ave
- 2915 Indiana Ave