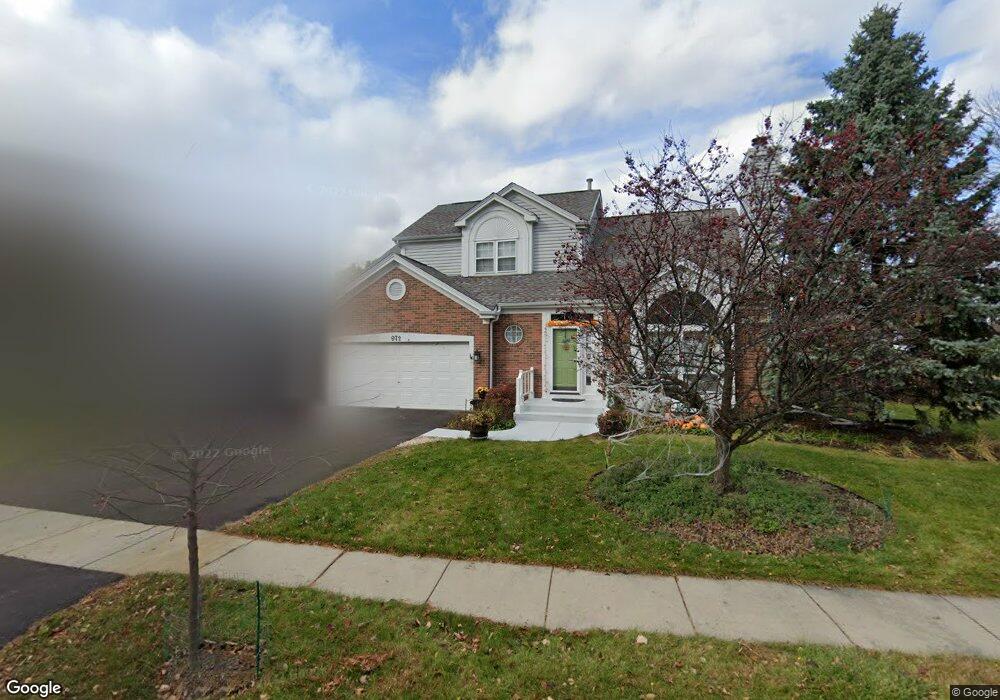
972 Braymore Dr Grayslake, IL 60030
Estimated Value: $363,000 - $464,000
3
Beds
3
Baths
2,197
Sq Ft
$197/Sq Ft
Est. Value
About This Home
This home is located at 972 Braymore Dr, Grayslake, IL 60030 and is currently estimated at $431,849, approximately $196 per square foot. 972 Braymore Dr is a home located in Lake County with nearby schools including Woodland Primary School, Woodland Elementary School, and Woodland Intermediate School.
Ownership History
Date
Name
Owned For
Owner Type
Purchase Details
Closed on
May 16, 2006
Sold by
Deno Craig R and Deno Jill S
Bought by
Ricard Eric J and Ricard Linda M
Current Estimated Value
Home Financials for this Owner
Home Financials are based on the most recent Mortgage that was taken out on this home.
Original Mortgage
$210,400
Outstanding Balance
$123,658
Interest Rate
6.66%
Mortgage Type
Fannie Mae Freddie Mac
Estimated Equity
$308,191
Purchase Details
Closed on
Aug 19, 1999
Sold by
Divito Gary J and Divito Linda M
Bought by
Deno Craig R and Binder Jill S
Home Financials for this Owner
Home Financials are based on the most recent Mortgage that was taken out on this home.
Original Mortgage
$150,400
Interest Rate
7.77%
Purchase Details
Closed on
Sep 30, 1994
Sold by
Olig Cameron J and Olig Elizabeth G
Bought by
Divito Gary J and Divito Linda M
Home Financials for this Owner
Home Financials are based on the most recent Mortgage that was taken out on this home.
Original Mortgage
$144,900
Interest Rate
6.62%
Create a Home Valuation Report for This Property
The Home Valuation Report is an in-depth analysis detailing your home's value as well as a comparison with similar homes in the area
Home Values in the Area
Average Home Value in this Area
Purchase History
| Date | Buyer | Sale Price | Title Company |
|---|---|---|---|
| Ricard Eric J | $263,000 | Ticor | |
| Deno Craig R | $188,000 | 1St American Title | |
| Divito Gary J | $161,000 | Chicago Title Insurance Co |
Source: Public Records
Mortgage History
| Date | Status | Borrower | Loan Amount |
|---|---|---|---|
| Open | Ricard Eric J | $210,400 | |
| Previous Owner | Deno Craig R | $150,400 | |
| Previous Owner | Divito Gary J | $144,900 |
Source: Public Records
Tax History Compared to Growth
Tax History
| Year | Tax Paid | Tax Assessment Tax Assessment Total Assessment is a certain percentage of the fair market value that is determined by local assessors to be the total taxable value of land and additions on the property. | Land | Improvement |
|---|---|---|---|---|
| 2024 | $11,340 | $118,866 | $25,720 | $93,146 |
| 2023 | $10,681 | $109,091 | $23,605 | $85,486 |
| 2022 | $10,681 | $101,471 | $17,239 | $84,232 |
| 2021 | $10,521 | $97,531 | $16,570 | $80,961 |
| 2020 | $10,938 | $96,657 | $15,767 | $80,890 |
| 2019 | $8,818 | $98,667 | $15,127 | $83,540 |
| 2018 | $8,935 | $80,021 | $18,658 | $61,363 |
| 2017 | $8,845 | $75,272 | $17,551 | $57,721 |
| 2016 | $8,477 | $69,484 | $16,201 | $53,283 |
| 2015 | $8,128 | $63,479 | $14,801 | $48,678 |
| 2014 | $7,756 | $59,622 | $14,277 | $45,345 |
| 2012 | $7,722 | $62,269 | $14,911 | $47,358 |
Source: Public Records
Map
Nearby Homes
- 355 Buckingham Dr
- 399 Banbury Ln
- 23 Bobolink Dr
- 707 Crossland Dr
- 633 Dove Ct Unit 4
- 745 Dillon Ct
- 820 Amelia Ct
- 1191 Hummingbird Ln
- 873 Essex Cir
- 618 Barron Blvd
- 418 Flanders Ln
- 1045 Manchester Cir
- 20295 W Washington St
- 146 Westerfield Place
- 1617 Albany St
- 33276 N Sunset Ave
- 268 Normandy Ln
- 33336 N Indian Ln
- 121 Park Ave
- 390 N Garfield Blvd
- 958 Braymore Dr
- 298 Dorchester Ln
- 946 Braymore Dr
- 302 Dorchester Ln
- 981 Braymore Dr
- 297 Buckingham Dr
- 965 Braymore Dr
- 934 Braymore Dr Unit 2
- 959 Braymore Dr
- 306 Dorchester Ln
- 951 Braymore Dr
- 301 Buckingham Dr
- 926 Braymore Dr
- 302 Buckingham Dr
- 310 Dorchester Ln
- 286 Buckingham Dr
- 309 Buckingham Dr
- 930 Dunhill Rd
- 914 Braymore Dr
- 934 Dunhill Rd