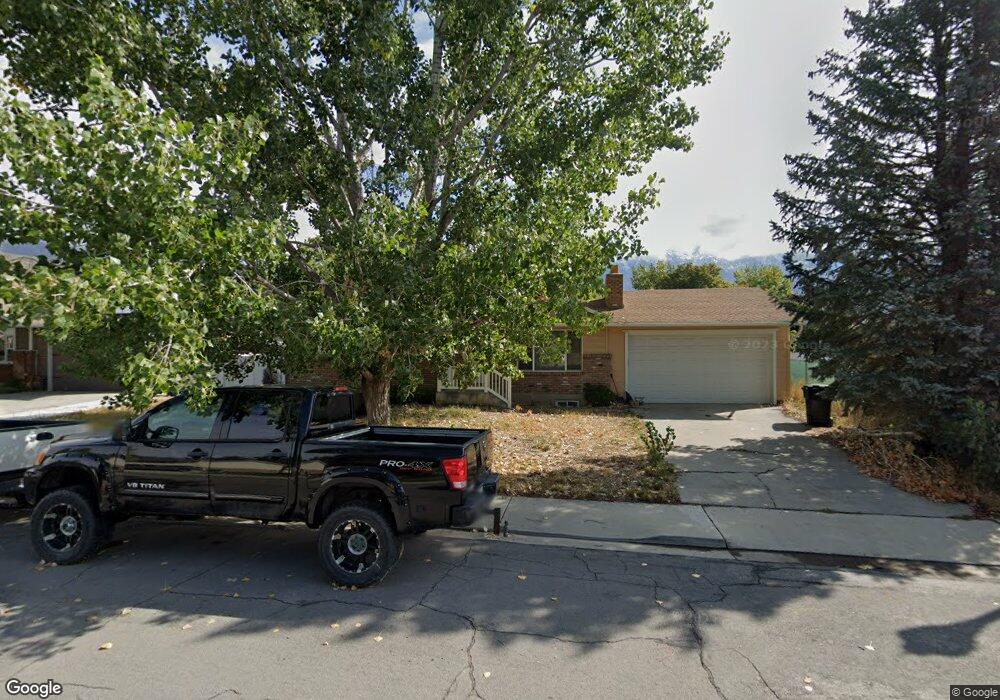
972 N 475 E Orem, UT 84097
Old Orchard NeighborhoodEstimated Value: $524,000 - $547,502
4
Beds
4
Baths
2,408
Sq Ft
$222/Sq Ft
Est. Value
About This Home
This home is located at 972 N 475 E, Orem, UT 84097 and is currently estimated at $535,501, approximately $222 per square foot. 972 N 475 E is a home located in Utah County with nearby schools including Orchard Elementary School, Canyon View Junior High School, and Orem High School.
Ownership History
Date
Name
Owned For
Owner Type
Purchase Details
Closed on
May 1, 2017
Sold by
Wennerholm Scott R and Wennerholm Traci A
Bought by
Probst Landen Taylor
Current Estimated Value
Home Financials for this Owner
Home Financials are based on the most recent Mortgage that was taken out on this home.
Original Mortgage
$223,550
Outstanding Balance
$186,920
Interest Rate
4.3%
Mortgage Type
New Conventional
Estimated Equity
$348,581
Purchase Details
Closed on
Sep 23, 2010
Sold by
Wennerholm Scott R
Bought by
Wennerholm Scott R and Wennerholm Traci A
Home Financials for this Owner
Home Financials are based on the most recent Mortgage that was taken out on this home.
Original Mortgage
$215,261
Interest Rate
3.75%
Mortgage Type
FHA
Purchase Details
Closed on
Oct 23, 2009
Sold by
Wennerholm Scott R
Bought by
Wennerholm Scott R and Wennerholm Traci A
Home Financials for this Owner
Home Financials are based on the most recent Mortgage that was taken out on this home.
Original Mortgage
$214,165
Interest Rate
5%
Mortgage Type
FHA
Purchase Details
Closed on
Dec 18, 2008
Sold by
Wennerholm Scott R
Bought by
Wennerholm Scott R and Wennerholm Traci A
Home Financials for this Owner
Home Financials are based on the most recent Mortgage that was taken out on this home.
Original Mortgage
$212,124
Interest Rate
6.16%
Mortgage Type
FHA
Purchase Details
Closed on
Aug 4, 2005
Sold by
Wennerholm Traci A
Bought by
Wennerholm Scott Roy and Wennerholm Traci A
Home Financials for this Owner
Home Financials are based on the most recent Mortgage that was taken out on this home.
Original Mortgage
$32,800
Interest Rate
5.56%
Mortgage Type
Fannie Mae Freddie Mac
Purchase Details
Closed on
Aug 2, 2002
Sold by
Bucklew Mary L
Bought by
Bucklew Gregory L and Bucklew Mary L
Create a Home Valuation Report for This Property
The Home Valuation Report is an in-depth analysis detailing your home's value as well as a comparison with similar homes in the area
Home Values in the Area
Average Home Value in this Area
Purchase History
| Date | Buyer | Sale Price | Title Company |
|---|---|---|---|
| Probst Landen Taylor | -- | United West Title | |
| Wennerholm Scott R | -- | Inwest Title Services Inc | |
| Wennerholm Scott R | -- | Inwest Title Services Inc | |
| Wennerholm Scott R | -- | Accommodation | |
| Wennerholm Scott R | -- | Inwest Title Services Inc | |
| Wennerholm Scott R | -- | Accommodation | |
| Wennerholm Scott R | -- | Inwest Title Services Inc | |
| Wennerholm Scott Roy | -- | Inwest Title Services Inc | |
| Wennerholm Traci A | -- | Equity Title | |
| Bucklew Gregory L | -- | Provo Land Title Company |
Source: Public Records
Mortgage History
| Date | Status | Borrower | Loan Amount |
|---|---|---|---|
| Open | Probst Landen Taylor | $223,550 | |
| Previous Owner | Wennerholm Scott R | $215,261 | |
| Previous Owner | Wennerholm Scott R | $214,165 | |
| Previous Owner | Wennerholm Scott R | $212,124 | |
| Previous Owner | Wennerholm Traci A | $32,800 | |
| Previous Owner | Wennerholm Scott Roy | $131,200 |
Source: Public Records
Tax History
| Year | Tax Paid | Tax Assessment Tax Assessment Total Assessment is a certain percentage of the fair market value that is determined by local assessors to be the total taxable value of land and additions on the property. | Land | Improvement |
|---|---|---|---|---|
| 2025 | $2,176 | $290,125 | -- | -- |
| 2024 | $2,176 | $266,090 | $0 | $0 |
| 2023 | $1,987 | $261,195 | $0 | $0 |
| 2022 | $1,975 | $251,460 | $0 | $0 |
| 2021 | $1,668 | $321,600 | $138,800 | $182,800 |
| 2020 | $1,531 | $290,200 | $111,000 | $179,200 |
| 2019 | $1,354 | $266,900 | $100,600 | $166,300 |
| 2018 | $1,399 | $263,500 | $97,200 | $166,300 |
| 2017 | $1,398 | $141,075 | $0 | $0 |
| 2016 | $1,305 | $121,440 | $0 | $0 |
| 2015 | $1,299 | $114,235 | $0 | $0 |
| 2014 | $1,217 | $106,590 | $0 | $0 |
Source: Public Records
Map
Nearby Homes
- 976 N 560 E
- 372 E 1165 N
- 362 E 800 N Unit 1
- 471 E 700 N
- 917 N Garden Dr
- 710 E 1280 N
- 789 200 E Unit 787
- 1371 N 330 E Unit 8
- 733 E 1450 N Unit 5
- 713 E 1450 N Unit 23
- 1324 N 750 E Unit 3
- 723 E 1450 N Unit 25
- 16 E 925 N
- 1356 N 750 E Unit 11
- 1366 N 750 E
- 747 E 1500 N Unit 13
- 363 E 1395 N Unit 22
- 713 E 1500 St N Unit 19
- 620 N 120 E
- 1480 N 430 E
Your Personal Tour Guide
Ask me questions while you tour the home.