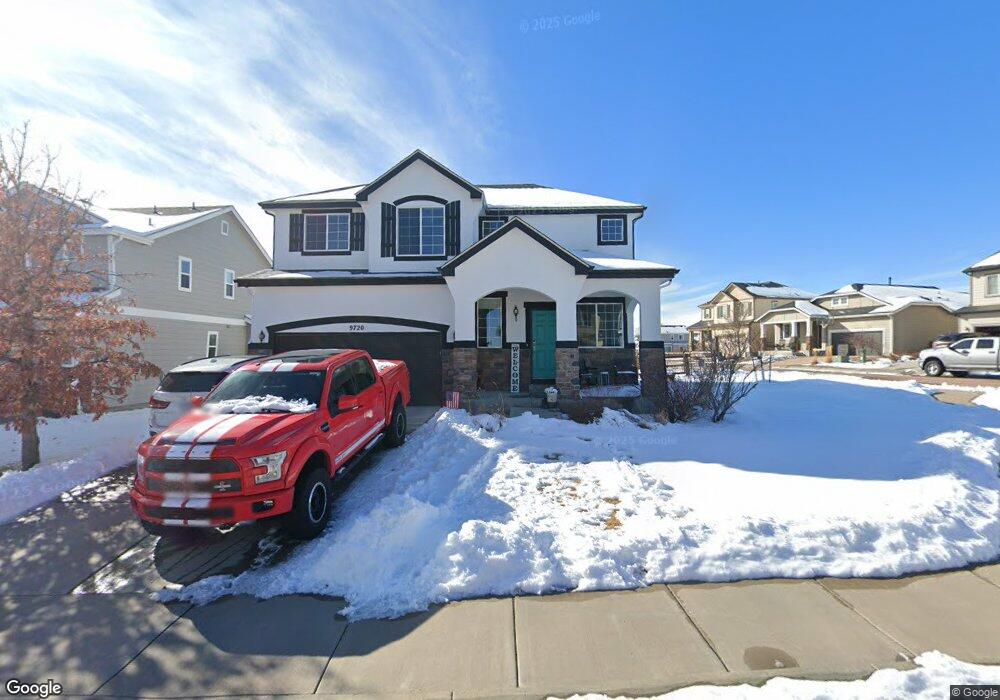
9720 Beryl Dr Peyton, CO 80831
Falcon NeighborhoodEstimated Value: $450,769 - $486,000
3
Beds
3
Baths
1,902
Sq Ft
$249/Sq Ft
Est. Value
About This Home
This home is located at 9720 Beryl Dr, Peyton, CO 80831 and is currently estimated at $473,942, approximately $249 per square foot. 9720 Beryl Dr is a home located in El Paso County with nearby schools including Woodmen Hills Elementary School, Falcon Middle School, and Falcon High School.
Ownership History
Date
Name
Owned For
Owner Type
Purchase Details
Closed on
Sep 2, 2014
Sold by
Kent Shannon and Kent Staci
Bought by
Groppi Michael J and Groppi Lindsay D
Current Estimated Value
Home Financials for this Owner
Home Financials are based on the most recent Mortgage that was taken out on this home.
Original Mortgage
$248,417
Outstanding Balance
$188,264
Interest Rate
3.87%
Mortgage Type
FHA
Estimated Equity
$285,678
Purchase Details
Closed on
Apr 9, 2010
Sold by
Bradner Jeffrey B and Bradner Tracey L
Bought by
Kent Shannon and Kent Staci
Home Financials for this Owner
Home Financials are based on the most recent Mortgage that was taken out on this home.
Original Mortgage
$218,960
Interest Rate
4.87%
Mortgage Type
FHA
Purchase Details
Closed on
Jun 27, 2008
Sold by
Richmond American Homes Of Colorado Inc
Bought by
Bradner Jeffrey B and Bradner Tracey L
Home Financials for this Owner
Home Financials are based on the most recent Mortgage that was taken out on this home.
Original Mortgage
$260,274
Interest Rate
5.99%
Mortgage Type
VA
Create a Home Valuation Report for This Property
The Home Valuation Report is an in-depth analysis detailing your home's value as well as a comparison with similar homes in the area
Home Values in the Area
Average Home Value in this Area
Purchase History
| Date | Buyer | Sale Price | Title Company |
|---|---|---|---|
| Groppi Michael J | $253,000 | Unified Title Company | |
| Kent Shannon | $223,000 | Security Title | |
| Bradner Jeffrey B | $252,000 | Stewart Title |
Source: Public Records
Mortgage History
| Date | Status | Borrower | Loan Amount |
|---|---|---|---|
| Open | Groppi Michael J | $248,417 | |
| Previous Owner | Kent Shannon | $218,960 | |
| Previous Owner | Bradner Jeffrey B | $260,274 |
Source: Public Records
Tax History
| Year | Tax Paid | Tax Assessment Tax Assessment Total Assessment is a certain percentage of the fair market value that is determined by local assessors to be the total taxable value of land and additions on the property. | Land | Improvement |
|---|---|---|---|---|
| 2025 | $2,851 | $31,070 | -- | -- |
| 2024 | $2,729 | $31,620 | $7,200 | $24,420 |
| 2022 | $2,274 | $22,530 | $5,910 | $16,620 |
| 2021 | $2,356 | $23,170 | $6,080 | $17,090 |
| 2020 | $2,311 | $21,070 | $5,510 | $15,560 |
| 2019 | $2,298 | $21,070 | $5,510 | $15,560 |
| 2018 | $2,132 | $19,350 | $5,040 | $14,310 |
| 2017 | $2,016 | $19,350 | $5,040 | $14,310 |
| 2016 | $2,072 | $20,360 | $5,570 | $14,790 |
| 2015 | $2,073 | $20,360 | $5,570 | $14,790 |
| 2014 | $1,908 | $18,510 | $4,780 | $13,730 |
Source: Public Records
Map
Nearby Homes
- 10025 Beryl Dr
- 11908 Eagle Crest Ct
- 9880 Everglades Dr
- 9881 Everglades Dr
- 12113 Eagle Crest Ct
- 12216 Chimney Smoke Dr
- 9863 Walnut Canyon Dr
- 12144 Point Reyes Dr
- 12256 Chimney Smoke Dr
- 11650 Cranston Dr
- 10342 Biscayne Dr
- 12252 Point Reyes Dr
- 9385 Winged Foot Rd
- 10135 Kings Canyon Dr
- 10429 Cedar Breaks Dr
- 9188 Sunningdale Rd
- 10476 Ross Lake Dr
- 11674 Allendale Dr
- 10489 Cedar Breaks Dr
- 10488 Cedar Breaks Dr
- 9714 Beryl Dr
- 9786 Fleece Flower Way
- 9708 Beryl Dr
- 9778 Fleece Flower Way
- 11850 Kalmath Way
- 11840 Kalmath Way
- 9702 Beryl Dr
- 9713 Beryl Dr
- 9770 Fleece Flower Way
- 9719 Beryl Dr
- 11830 Kalmath Way
- 9725 Beryl Dr
- 9707 Beryl Dr
- 9762 Fleece Flower Way
- 9696 Beryl Dr
- 9737 Beryl Dr
- 9756 Beryl Dr
- 9743 Beryl Dr
- 9695 Beryl Dr
- 9754 Fleece Flower Way
Your Personal Tour Guide
Ask me questions while you tour the home.