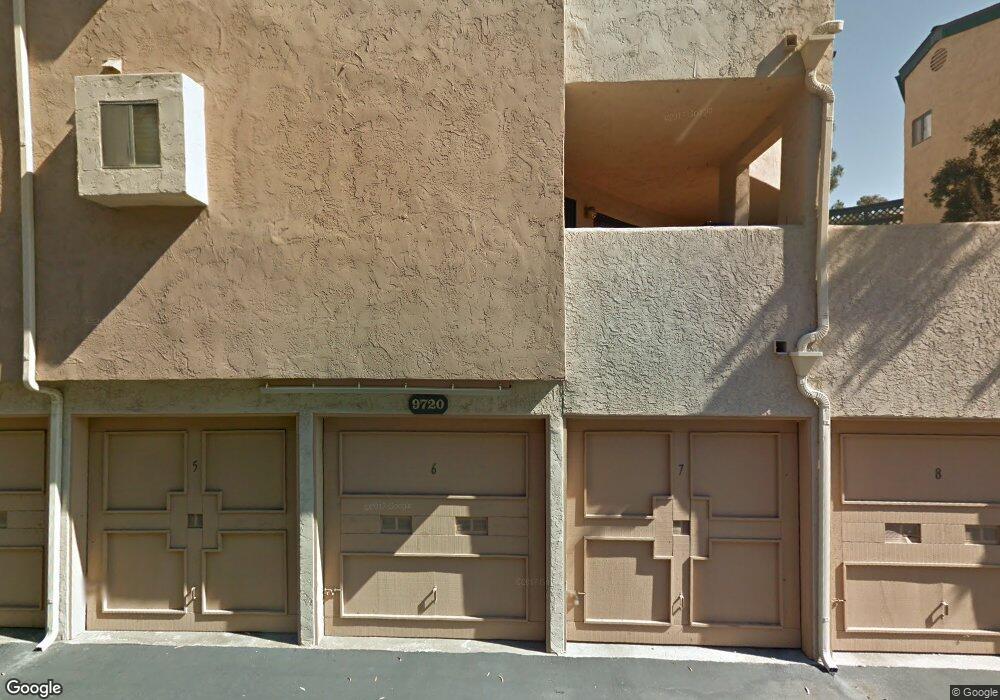
9720 Mesa Springs Way Unit 12 San Diego, CA 92126
Mira Mesa NeighborhoodEstimated Value: $560,699 - $604,000
2
Beds
2
Baths
1,041
Sq Ft
$556/Sq Ft
Est. Value
About This Home
This home is located at 9720 Mesa Springs Way Unit 12, San Diego, CA 92126 and is currently estimated at $578,925, approximately $556 per square foot. 9720 Mesa Springs Way Unit 12 is a home located in San Diego County with nearby schools including Walker Elementary School, Wangenheim Middle School, and Mira Mesa High School.
Ownership History
Date
Name
Owned For
Owner Type
Purchase Details
Closed on
Sep 19, 2003
Sold by
Browne David W and Browne Deitre L
Bought by
Chapman Ralph B and Chapman Teri
Current Estimated Value
Home Financials for this Owner
Home Financials are based on the most recent Mortgage that was taken out on this home.
Original Mortgage
$226,000
Outstanding Balance
$105,058
Interest Rate
6.27%
Mortgage Type
Stand Alone First
Estimated Equity
$473,867
Purchase Details
Closed on
May 20, 1994
Sold by
Edwards Donna E and Robinson Christopher
Bought by
Browne David W and Browne Deitre L
Home Financials for this Owner
Home Financials are based on the most recent Mortgage that was taken out on this home.
Original Mortgage
$113,800
Interest Rate
8.3%
Mortgage Type
VA
Purchase Details
Closed on
Jan 5, 1994
Sold by
Edwards Donna E
Bought by
Edwards Donna E and Robinson Christopher
Purchase Details
Closed on
Apr 19, 1984
Create a Home Valuation Report for This Property
The Home Valuation Report is an in-depth analysis detailing your home's value as well as a comparison with similar homes in the area
Home Values in the Area
Average Home Value in this Area
Purchase History
| Date | Buyer | Sale Price | Title Company |
|---|---|---|---|
| Chapman Ralph B | $282,500 | Equity Title Company | |
| Browne David W | $114,000 | Fidelity National Title | |
| Edwards Donna E | -- | -- | |
| -- | $75,700 | -- |
Source: Public Records
Mortgage History
| Date | Status | Borrower | Loan Amount |
|---|---|---|---|
| Open | Chapman Ralph B | $226,000 | |
| Previous Owner | Browne David W | $113,800 |
Source: Public Records
Tax History Compared to Growth
Tax History
| Year | Tax Paid | Tax Assessment Tax Assessment Total Assessment is a certain percentage of the fair market value that is determined by local assessors to be the total taxable value of land and additions on the property. | Land | Improvement |
|---|---|---|---|---|
| 2025 | $4,794 | $401,633 | $273,680 | $127,953 |
| 2024 | $4,794 | $393,759 | $268,314 | $125,445 |
| 2023 | $4,686 | $386,039 | $263,053 | $122,986 |
| 2022 | $4,560 | $378,471 | $257,896 | $120,575 |
| 2021 | $4,527 | $371,051 | $252,840 | $118,211 |
| 2020 | $4,471 | $367,247 | $250,248 | $116,999 |
| 2019 | $4,389 | $360,047 | $245,342 | $114,705 |
| 2018 | $4,104 | $352,988 | $240,532 | $112,456 |
| 2017 | $80 | $320,000 | $192,000 | $128,000 |
| 2016 | $3,476 | $300,000 | $180,000 | $120,000 |
| 2015 | $3,124 | $270,000 | $162,000 | $108,000 |
| 2014 | $2,783 | $240,000 | $144,000 | $96,000 |
Source: Public Records
Map
Nearby Homes
- 9725 Mesa Springs Way Unit 176
- 9765 Mesa Springs Way Unit 66
- 9755 Mesa Springs Way Unit 126
- 10076 Maya Linda Rd Unit 1101
- 10112 Caminito Volar
- 10026 Maya Linda Rd Unit 6101
- 10143 Caminito Volar Unit 185
- 10248 Maya Linda Rd Unit 33
- 10224 Maya Linda Rd Unit 17
- 9504 Carroll Canyon Rd Unit 202
- 10249 Black Mountain Rd Unit Q3
- 10226 Black Mountain Rd Unit 78
- 10226 Black Mountain Rd Unit 87
- 10222 Black Mountain Rd Unit 69
- 10258 Black Mountain Rd Unit 145
- 10284 Black Mountain Rd Unit 198
- 9931 Caminito Tomatillo
- 10263 Caminito Toronjo
- 10280 Caminito Rio Branco
- 10276 Caminito Covewood
- 9710 Mesa Springs Way
- 9710 Mesa Springs Way Unit 7
- 9730 Mesa Springs Way Unit 26
- 9730 Mesa Springs Way Unit 25
- 9730 Mesa Springs Way Unit 24
- 9730 Mesa Springs Way Unit 22
- 9730 Mesa Springs Way Unit 21
- 9720 Mesa Springs Way Unit 20
- 9720 Mesa Springs Way Unit 19
- 9720 Mesa Springs Way Unit 18
- 9720 Mesa Springs Way Unit 17
- 9720 Mesa Springs Way Unit 16
- 9720 Mesa Springs Way Unit 15
- 9720 Mesa Springs Way Unit 14
- 9720 Mesa Springs Way Unit 13
- 9720 Mesa Springs Way Unit 11
- 9730 Mesa Springs Way Unit 29
- 9710 Mesa Springs Way Unit 10
- 9710 Mesa Springs Way Unit 9
- 9710 Mesa Springs Way Unit 8