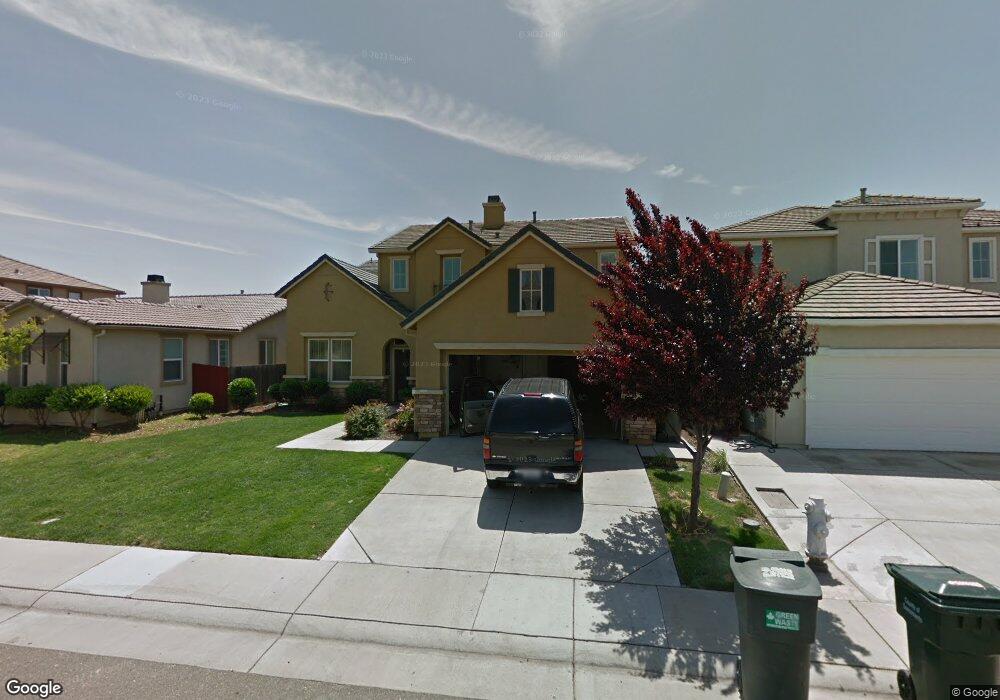
9720 Splender Way Sacramento, CA 95829
Estimated Value: $566,000 - $694,000
4
Beds
3
Baths
2,385
Sq Ft
$264/Sq Ft
Est. Value
About This Home
This home is located at 9720 Splender Way, Sacramento, CA 95829 and is currently estimated at $630,619, approximately $264 per square foot. 9720 Splender Way is a home located in Sacramento County with nearby schools including Robert J. Fite Elementary School, T. R. Smedberg Middle School, and Sheldon High School.
Ownership History
Date
Name
Owned For
Owner Type
Purchase Details
Closed on
Mar 12, 2021
Sold by
Siu On Nai
Bought by
Siu Onnai and The Onnai Siu Revocable Trust
Current Estimated Value
Purchase Details
Closed on
Oct 6, 2009
Sold by
First National Financial Group Llc
Bought by
Siu On Nai
Purchase Details
Closed on
Sep 18, 2009
Sold by
Nhan Thuan
Bought by
First National Financial Group Llc
Purchase Details
Closed on
May 28, 2008
Sold by
Nhan Thuan
Bought by
Nhan Linh and Nhan Douglas
Purchase Details
Closed on
Jul 23, 2007
Sold by
Nhan Thuan
Bought by
Nhan Thuan and Nhan Douglas
Purchase Details
Closed on
Feb 24, 2005
Sold by
Richmond American Homes Of Ca Inc
Bought by
Nhan Thuan
Home Financials for this Owner
Home Financials are based on the most recent Mortgage that was taken out on this home.
Original Mortgage
$352,200
Interest Rate
5.37%
Mortgage Type
New Conventional
Create a Home Valuation Report for This Property
The Home Valuation Report is an in-depth analysis detailing your home's value as well as a comparison with similar homes in the area
Home Values in the Area
Average Home Value in this Area
Purchase History
| Date | Buyer | Sale Price | Title Company |
|---|---|---|---|
| Siu Onnai | -- | None Available | |
| Onnai Siu Revocable Trust | -- | Yang Clara | |
| Siu On Nai | $250,000 | Placer Title Company | |
| First National Financial Group Llc | $202,500 | None Available | |
| Nhan Linh | -- | None Available | |
| Nhan Thuan | -- | None Available | |
| Nhan Thuan | $441,500 | Stewart Title Of Sacramento |
Source: Public Records
Mortgage History
| Date | Status | Borrower | Loan Amount |
|---|---|---|---|
| Previous Owner | Nhan Thuan | $352,200 |
Source: Public Records
Tax History Compared to Growth
Tax History
| Year | Tax Paid | Tax Assessment Tax Assessment Total Assessment is a certain percentage of the fair market value that is determined by local assessors to be the total taxable value of land and additions on the property. | Land | Improvement |
|---|---|---|---|---|
| 2025 | $3,803 | $322,689 | $129,073 | $193,616 |
| 2024 | $3,803 | $316,363 | $126,543 | $189,820 |
| 2023 | $3,715 | $310,161 | $124,062 | $186,099 |
| 2022 | $3,656 | $304,080 | $121,630 | $182,450 |
| 2021 | $3,620 | $298,119 | $119,246 | $178,873 |
| 2020 | $3,575 | $295,063 | $118,024 | $177,039 |
| 2019 | $3,516 | $289,278 | $115,710 | $173,568 |
| 2018 | $3,429 | $283,607 | $113,442 | $170,165 |
| 2017 | $3,375 | $278,047 | $111,218 | $166,829 |
| 2016 | $3,219 | $272,596 | $109,038 | $163,558 |
| 2015 | $3,164 | $268,503 | $107,401 | $161,102 |
| 2014 | $3,117 | $263,245 | $105,298 | $157,947 |
Source: Public Records
Map
Nearby Homes
- 9865 Fall Valley Way
- 9781 Fall Valley Way
- 9633 Respect Dr
- 8210 Scrimshaw Way
- 9864 Wildhawk Dr W
- 8298 Courage Dr
- 8295 Carmencita Ave
- 7775 Saptal Way
- 7776 Sikh Ct
- 7781 Sikh Ct
- 7772 Sikh Ct
- 9826 Amisha Way
- 9980 Crystal Creek Dr
- 9835 Amisha Way
- 7724 Congaree Way
- 7728 Congaree Way
- 7736 Congaree Way
- 9828 Great Basin Way
- 9832 Great Basin Way
- 7855 Yellow Cups Way
- 9716 Splender Way
- 9724 Splender Way
- 9721 Everbloom Way
- 9712 Splender Way
- 9728 Splender Way
- 9717 Everbloom Way
- 9725 Everbloom Way
- 9721 Splender Way
- 9713 Everbloom Way
- 9717 Splender Way
- 9725 Splender Way
- 9708 Splender Way
- 9732 Splender Way
- 9713 Splender Way
- 9729 Splender Way
- 9709 Everbloom Way
- 9709 Splender Way
- 9704 Splender Way
- 9736 Splender Way
- 9735 Splender Way