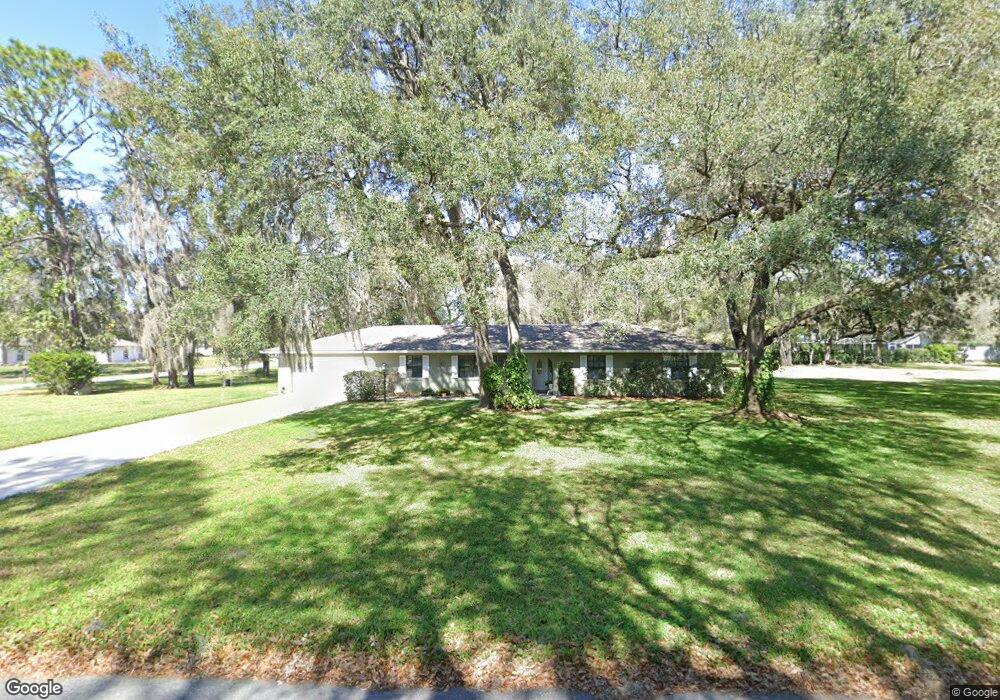
9721 E Regency Row Inverness, FL 34450
Estimated Value: $286,234 - $321,000
3
Beds
3
Baths
1,761
Sq Ft
$175/Sq Ft
Est. Value
About This Home
This home is located at 9721 E Regency Row, Inverness, FL 34450 and is currently estimated at $308,309, approximately $175 per square foot. 9721 E Regency Row is a home located in Citrus County with nearby schools including Inverness Primary School, Inverness Middle School, and Citrus High School.
Ownership History
Date
Name
Owned For
Owner Type
Purchase Details
Closed on
Mar 27, 2024
Sold by
Mendicino Nettles Lynn
Bought by
Nettles Lynn Mendicino and Mendicino-Clark Erik
Current Estimated Value
Purchase Details
Closed on
Feb 8, 2024
Sold by
Mendicino Lynn
Bought by
Mendicino-Clark Erik
Purchase Details
Closed on
Aug 19, 2010
Sold by
Bomke Glenn W and Bomke Joanne S
Bought by
Nettles Lynn M
Home Financials for this Owner
Home Financials are based on the most recent Mortgage that was taken out on this home.
Original Mortgage
$88,000
Interest Rate
4.6%
Mortgage Type
New Conventional
Purchase Details
Closed on
Mar 1, 1997
Bought by
Nettles Lynn M
Purchase Details
Closed on
Jul 1, 1986
Bought by
Nettles Lynn M
Purchase Details
Closed on
May 1, 1980
Bought by
Nettles Lynn M
Purchase Details
Closed on
Apr 1, 1979
Bought by
Nettles Lynn M
Create a Home Valuation Report for This Property
The Home Valuation Report is an in-depth analysis detailing your home's value as well as a comparison with similar homes in the area
Home Values in the Area
Average Home Value in this Area
Purchase History
| Date | Buyer | Sale Price | Title Company |
|---|---|---|---|
| Nettles Lynn Mendicino | -- | None Listed On Document | |
| Nettles Lynn Mendicino | -- | None Listed On Document | |
| Mendicino-Clark Erik | -- | None Listed On Document | |
| Mendicino-Clark Erik | -- | None Listed On Document | |
| Nettles Lynn M | $110,000 | Southern Security Title Serv | |
| Nettles Lynn M | $82,900 | -- | |
| Nettles Lynn M | $88,500 | -- | |
| Nettles Lynn M | $78,000 | -- | |
| Nettles Lynn M | $200 | -- |
Source: Public Records
Mortgage History
| Date | Status | Borrower | Loan Amount |
|---|---|---|---|
| Previous Owner | Nettles Lynn M | $88,000 |
Source: Public Records
Tax History
| Year | Tax Paid | Tax Assessment Tax Assessment Total Assessment is a certain percentage of the fair market value that is determined by local assessors to be the total taxable value of land and additions on the property. | Land | Improvement |
|---|---|---|---|---|
| 2025 | $989 | $99,391 | -- | -- |
| 2024 | $956 | $96,590 | -- | -- |
| 2023 | $956 | $93,777 | $0 | $0 |
| 2022 | $895 | $91,046 | $0 | $0 |
| 2021 | $858 | $88,394 | $0 | $0 |
| 2020 | $793 | $129,900 | $8,600 | $121,300 |
| 2019 | $776 | $116,140 | $8,600 | $107,540 |
| 2018 | $745 | $110,922 | $8,600 | $102,322 |
| 2017 | $736 | $81,905 | $8,600 | $73,305 |
| 2016 | $737 | $80,220 | $11,850 | $68,370 |
| 2015 | $742 | $79,662 | $11,850 | $67,812 |
| 2014 | $751 | $79,030 | $12,570 | $66,460 |
Source: Public Records
Map
Nearby Homes
- 3203 S Skyline Dr
- 3030 S Bay Berry Point
- 3110 S Eagle Terrace
- 9913 E Saint Regis Ct
- 2908 S Skyline Dr
- 3072 S Cygnet Terrace
- 3341 S Jean Point
- 3211 S Rose Ave
- 3002 S Rose Ave
- 956 Ibis Cir
- 3499 S Stroud Terrace
- 3770 Kingfisher St
- 3371 S Winding Path
- 1170 S Heron Point
- 1117 S Heron Point
- 3720 S Heron Point
- 3757 S Heron Point
- 1100 S Heron Point
- 3733 S Heron Point
- 1090 S Heron Point
- 9730 E Regency Row
- 9700 E Regency Row
- 9801 E Regency Row
- 9800 E Regency Row
- 3137 S Canal Rd
- 9708 E Woodmere Ln
- 9720 E Seven Lakes Ct
- 3134 S Skyline Dr
- 3127 S Bay Berry Point
- 9634 E Woodmere Ln
- 9673 E Seven Lakes Ct
- 3126 S Skyline Dr
- 3121 S Bay Berry Point
- 3122 S Bay Berry Point
- 9626 E Woodmere
- 3118 S Skyline Dr
- 9812 E Regency Row
- 3111 S Bay Berry Point
- 9616 E Woodmere
Your Personal Tour Guide
Ask me questions while you tour the home.