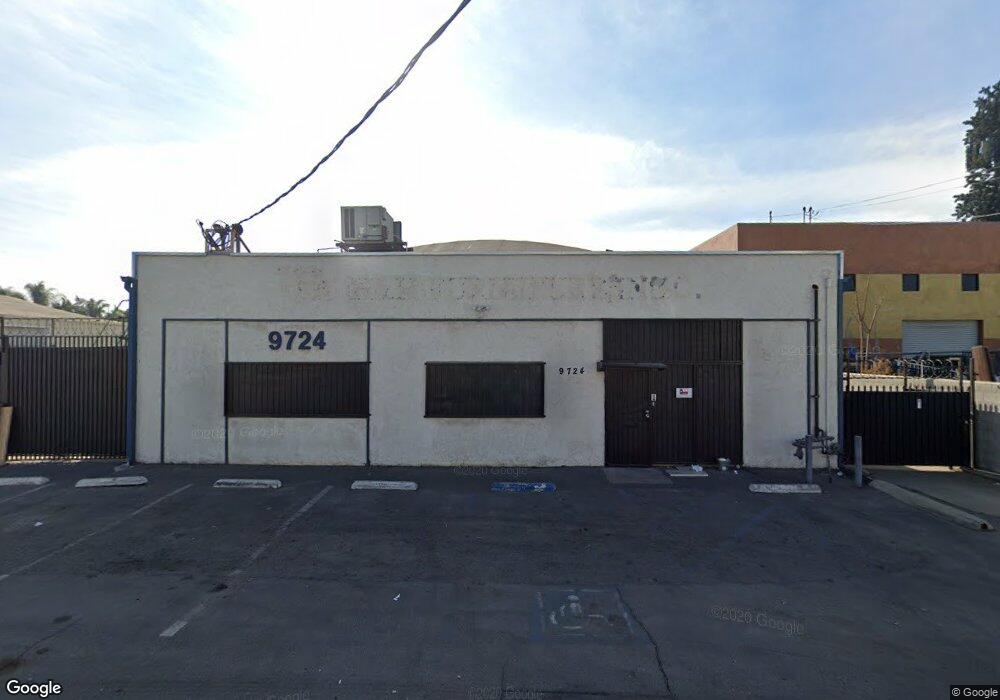
9724 Factorial Way South El Monte, CA 91733
Estimated Value: $2,001,718
--
Bed
--
Bath
7,400
Sq Ft
$271/Sq Ft
Est. Value
About This Home
This home is located at 9724 Factorial Way, South El Monte, CA 91733 and is currently estimated at $2,001,718, approximately $270 per square foot. 9724 Factorial Way is a home located in Los Angeles County with nearby schools including Potrero Elementary School, South El Monte High School, and Epiphany Catholic School.
Ownership History
Date
Name
Owned For
Owner Type
Purchase Details
Closed on
Aug 4, 2016
Sold by
Park Chan Sung
Bought by
Kwan Connie and Kwan Carrie
Current Estimated Value
Purchase Details
Closed on
Aug 12, 2015
Sold by
Kim Yoon Mi
Bought by
Park Chan Sung
Purchase Details
Closed on
Mar 3, 2014
Sold by
Him & Her Inc
Bought by
Apb Properties Inc
Purchase Details
Closed on
Feb 26, 2014
Sold by
Apb Properties Inc
Bought by
Him & Her Inc
Purchase Details
Closed on
Apr 15, 2011
Sold by
Perez Bernardo and Perez Carmen
Bought by
Him & Her Inc
Purchase Details
Closed on
Jan 30, 2004
Sold by
Resa Jolinda and Resa Trust
Bought by
Aegis El Monte Realty Lp
Purchase Details
Closed on
Oct 21, 2003
Sold by
Cole Eugene L and Cole Juanita G
Bought by
Catanzarite Kenneth J
Create a Home Valuation Report for This Property
The Home Valuation Report is an in-depth analysis detailing your home's value as well as a comparison with similar homes in the area
Home Values in the Area
Average Home Value in this Area
Purchase History
| Date | Buyer | Sale Price | Title Company |
|---|---|---|---|
| Kwan Connie | $1,200,000 | None Available | |
| Park Chan Sung | -- | None Available | |
| Park Chan Sung | -- | None Available | |
| Apb Properties Inc | -- | None Available | |
| Him & Her Inc | -- | Fidelity Sherman Oaks | |
| Him & Her Inc | $535,000 | Investors Title | |
| Aegis El Monte Realty Lp | -- | -- | |
| Catanzarite Kenneth J | $65,273 | -- |
Source: Public Records
Tax History Compared to Growth
Tax History
| Year | Tax Paid | Tax Assessment Tax Assessment Total Assessment is a certain percentage of the fair market value that is determined by local assessors to be the total taxable value of land and additions on the property. | Land | Improvement |
|---|---|---|---|---|
| 2025 | $18,304 | $1,392,696 | $714,918 | $677,778 |
| 2024 | $18,304 | $1,365,389 | $700,900 | $664,489 |
| 2023 | $17,784 | $1,338,617 | $687,157 | $651,460 |
| 2022 | $17,548 | $1,312,371 | $673,684 | $638,687 |
| 2021 | $17,153 | $1,286,639 | $660,475 | $626,164 |
| 2020 | $17,111 | $1,273,447 | $653,703 | $619,744 |
| 2019 | $17,575 | $1,248,479 | $640,886 | $607,593 |
| 2018 | $17,082 | $1,224,000 | $628,320 | $595,680 |
| 2016 | $11,602 | $800,931 | $357,144 | $443,787 |
| 2015 | $11,487 | $788,901 | $351,780 | $437,121 |
| 2014 | $8,403 | $559,140 | $344,890 | $214,250 |
Source: Public Records
Map
Nearby Homes
- 2458 Tamora Ave
- 2546 Potrero Ave
- 2550 Hepburn St
- 9404 Presley St
- 2544 Dorris St
- 2543 Dorris St
- 9417 Paramount St
- 9401 Presley St
- 9419 Paramount St
- 2540 Everly St
- Plan 2303 at Starlite - The Front Row at Astaire
- Plan 2090 at Starlite - The Front Row at Astaire
- Plan 1931 at Starlite - Harlow
- Plan 1781 Modeled at Starlite - Harlow
- Plan 1348 at Starlite - Harlow
- Plan 2026 Modeled at Starlite - Astaire
- Plan 1923 Modeled at Starlite - Astaire
- Plan 2088 Modeled at Starlite - Astaire
- 1517 Merced Ave Unit 52
- 1517 Merced Ave Unit 43