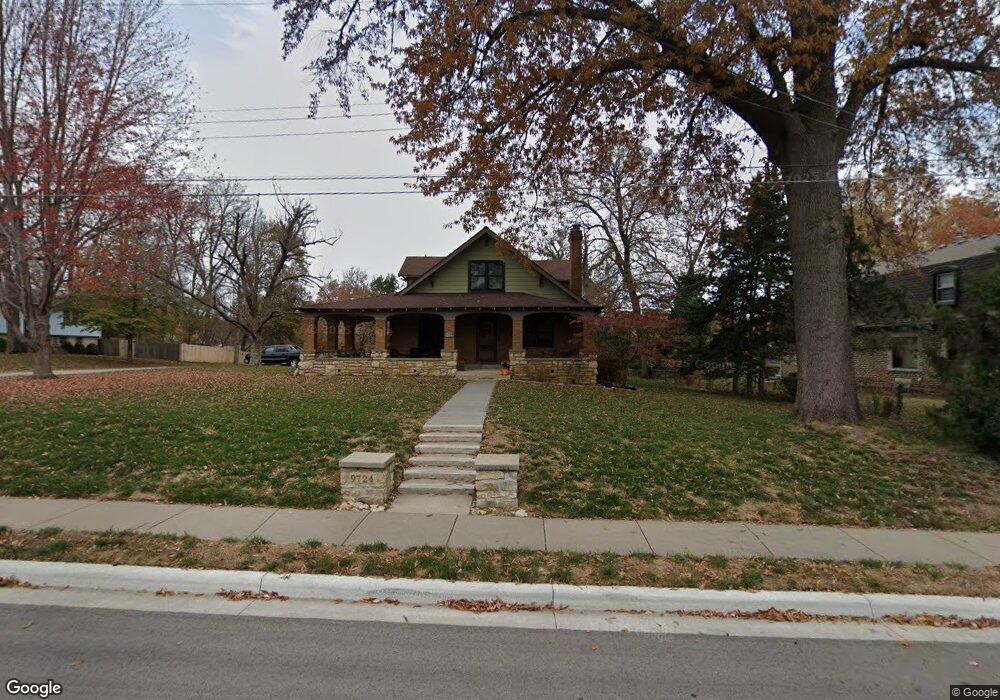
9724 Hocker Dr Shawnee, KS 66203
Estimated Value: $386,000 - $452,000
4
Beds
2
Baths
2,325
Sq Ft
$177/Sq Ft
Est. Value
About This Home
This home is located at 9724 Hocker Dr, Shawnee, KS 66203 and is currently estimated at $412,547, approximately $177 per square foot. 9724 Hocker Dr is a home located in Johnson County with nearby schools including Merriam Park Elementary School, Hocker Grove Middle School, and Shawnee Mission North High School.
Ownership History
Date
Name
Owned For
Owner Type
Purchase Details
Closed on
Oct 16, 2006
Sold by
Davis Timothy A
Bought by
Heffron Thomas E and Heffron Shannon Ruzich
Current Estimated Value
Purchase Details
Closed on
Sep 27, 2005
Sold by
Davis Timothy A
Bought by
Heffron Thomas E and Heffron Shannon Ruzich
Home Financials for this Owner
Home Financials are based on the most recent Mortgage that was taken out on this home.
Original Mortgage
$22,400
Interest Rate
5.65%
Mortgage Type
Stand Alone Second
Purchase Details
Closed on
Aug 6, 2002
Sold by
Kiley Kevin M and Kiley Laurie C
Bought by
Davis Timothy A
Home Financials for this Owner
Home Financials are based on the most recent Mortgage that was taken out on this home.
Original Mortgage
$125,000
Interest Rate
5.25%
Create a Home Valuation Report for This Property
The Home Valuation Report is an in-depth analysis detailing your home's value as well as a comparison with similar homes in the area
Home Values in the Area
Average Home Value in this Area
Purchase History
| Date | Buyer | Sale Price | Title Company |
|---|---|---|---|
| Heffron Thomas E | -- | Kansas City Title | |
| Heffron Thomas E | -- | Kansas City Title | |
| Davis Timothy A | -- | Kansas Title |
Source: Public Records
Mortgage History
| Date | Status | Borrower | Loan Amount |
|---|---|---|---|
| Previous Owner | Heffron Thomas E | $22,400 | |
| Previous Owner | Heffron Thomas E | $179,200 | |
| Previous Owner | Davis Timothy A | $125,000 | |
| Closed | Davis Timothy A | $45,000 |
Source: Public Records
Tax History Compared to Growth
Tax History
| Year | Tax Paid | Tax Assessment Tax Assessment Total Assessment is a certain percentage of the fair market value that is determined by local assessors to be the total taxable value of land and additions on the property. | Land | Improvement |
|---|---|---|---|---|
| 2024 | $4,908 | $44,908 | $7,006 | $37,902 |
| 2023 | $4,780 | $44,655 | $5,842 | $38,813 |
| 2022 | $4,877 | $43,838 | $5,842 | $37,996 |
| 2021 | $4,443 | $38,295 | $4,825 | $33,470 |
| 2020 | $3,983 | $34,097 | $4,387 | $29,710 |
| 2019 | $3,795 | $32,487 | $3,813 | $28,674 |
| 2018 | $3,707 | $31,591 | $3,470 | $28,121 |
| 2017 | $2,978 | $24,955 | $3,470 | $21,485 |
| 2016 | $2,789 | $23,230 | $3,470 | $19,760 |
| 2015 | $2,653 | $22,253 | $3,470 | $18,783 |
| 2013 | -- | $21,942 | $3,470 | $18,472 |
Source: Public Records
Map
Nearby Homes
- 9619 W 57th Place
- 9520 W 59th Terrace
- 5933 Knox Ave
- 10103 Johnson Dr
- 9931 W 56th St
- 6018 Knox Ave
- 9702 W 61st St
- 5517 Hayes St
- Ashwood Plan at Bristol Highlands - North
- The Fleetwood Plan at Bristol Highlands - The Villas
- Cypress II Plan at Bristol Highlands - North
- The Fleetwood Plan at Bristol Highlands - The Manors
- The Brentwood Plan at Bristol Highlands - The Villas
- Yorkshire V Plan at Bristol Highlands - North
- The Kirkwood Plan at Bristol Highlands - The Villas
- 8013 Payne St
- The Rockwood Plan at Bristol Highlands - The Villas
- Magnolia Plan at Bristol Highlands - North
- 9719 W 53rd St
- 5220 Hayes St
- 9716 Hocker Dr
- 5728 Connell Dr
- 9800 Hocker Dr
- 9719 Hocker Dr
- 5730 Connell Dr
- 5750 Knox Ave
- 9814 Hocker Dr
- 5750 Knox Ave
- 5732 Connell Dr
- 9707 Hocker Dr
- 9725 Hocker Dr
- 9815 Hocker Dr
- 9620 Hocker Dr
- 5757 Knox St
- 5740 Connell Dr
- 9826 Hocker Dr
- 5736 Connell Dr
- 9617 Hocker Dr
- 5738 Connell Dr
- 9821 Hocker Dr