9725 Cavell Ave S Bloomington, MN 55438
West Bloomington NeighborhoodEstimated Value: $262,000 - $294,000
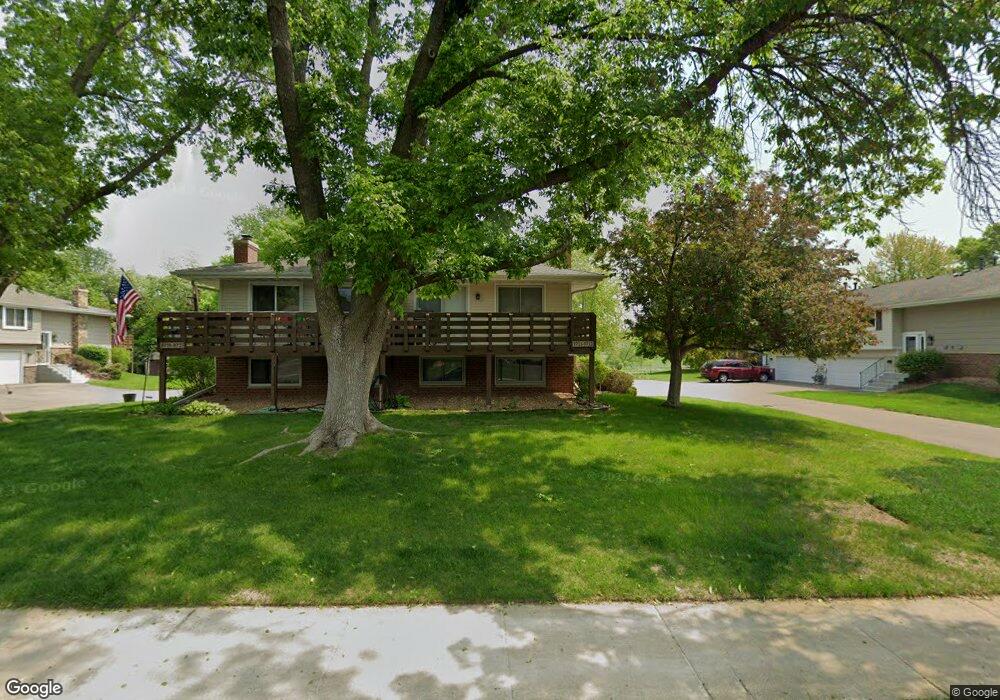
About This Home
This home is located at 9725 Cavell Ave S, Bloomington, MN 55438 and is currently estimated at $272,615, approximately $295 per square foot. 9725 Cavell Ave S is a home located in Hennepin County with nearby schools including Poplar Bridge Elementary School, Olson Middle School, and Jefferson Senior High School.
Ownership History
We collect this data history from publicly available records. To have your information removed, we recommend requesting removal directly through your county’s website.
Purchase Details
Home Financials for this Owner
Home Financials are based on the most recent Mortgage that was taken out on this home.Purchase Details
Purchase Details
Purchase Details
Purchase Details
Purchase Details
Home Values in the Area
Average Home Value in this Area
Purchase History
We collect this data history from publicly available records. To have your information removed, we recommend requesting removal directly through your county’s website.
| Date | Buyer | Sale Price | Title Company |
|---|---|---|---|
| $169,900 | Burnet Title | ||
| $98,000 | Entitle Inc | ||
| $146,235 | None Available | ||
| $172,400 | -- | ||
| $161,000 | -- | ||
| $124,000 | -- |
Mortgage History
We collect this data history from publicly available records. To have your information removed, we recommend requesting removal directly through your county’s website.
| Date | Status | Borrower | Loan Amount |
|---|---|---|---|
| Open | $166,822 |
Tax History
We collect this data history from publicly available records. To have your information removed, we recommend requesting removal directly through your county’s website.
| Year | Tax Paid | Tax Assessment Tax Assessment Total Assessment is a certain percentage of the fair market value that is determined by local assessors to be the total taxable value of land and additions on the property. | Land | Improvement |
|---|---|---|---|---|
| 2024 | $2,991 | $249,500 | $63,300 | $186,200 |
| 2023 | $3,012 | $259,900 | $63,300 | $196,600 |
| 2022 | $2,597 | $247,100 | $63,300 | $183,800 |
| 2021 | $2,491 | $216,000 | $59,200 | $156,800 |
| 2020 | $2,511 | $209,900 | $57,700 | $152,200 |
| 2019 | $2,115 | $206,100 | $57,500 | $148,600 |
| 2018 | $1,891 | $175,400 | $57,900 | $117,500 |
| 2017 | $1,644 | $141,100 | $50,200 | $90,900 |
| 2016 | $1,750 | $142,400 | $45,800 | $96,600 |
| 2015 | -- | $135,700 | $44,200 | $91,500 |
| 2014 | -- | $125,800 | $42,900 | $82,900 |
Map
- 9619 Ensign Cir
- 9528 Woodbridge Rd
- 9565 Yukon Ave S
- 9843 Cavell Cir
- 9731 Dorset Ln
- 9625 Hampshire Ln
- xxxx Linden Dr
- 9548 Virginia Ave S
- 8361 W 100th St
- 7631 S Bay Dr
- 9651 Belmont Ln
- 9675 Belmont Ln Unit 14
- 10247 Nottingham Trail
- 9515 Risewood Cir
- 8124 W 102nd St
- 10213 Cavell Cir
- 8100 W 102nd St
- 9836 Belmont Ln
- 10365 Buckingham Dr
- 10500 Niblick Ln
- 9727 Cavell Ave S
- 9719 Cavell Ave S
- 9723 Cavell Ave S
- 9733 Cavell Ave S
- 9717 Cavell Ave S
- 9721 Cavell Ave S
- 9729 Cavell Ave S
- 9715 Cavell Ave S
- 9735 Cavell Ave S
- 9712 Cavell Ave S
- 9709 Cavell Ave S
- 9708 Cavell Ave S
- 9704 Cavell Ave S
- 9713 Cavell Ave S
- 9737 Cavell Ave S
- 9731 Cavell Ave S
- 8401 W 97th St
- 9705 Cavell Ave S
- 9707 Cavell Ave S
- 9720 Cavell Cir
Ask me questions while you tour the home.