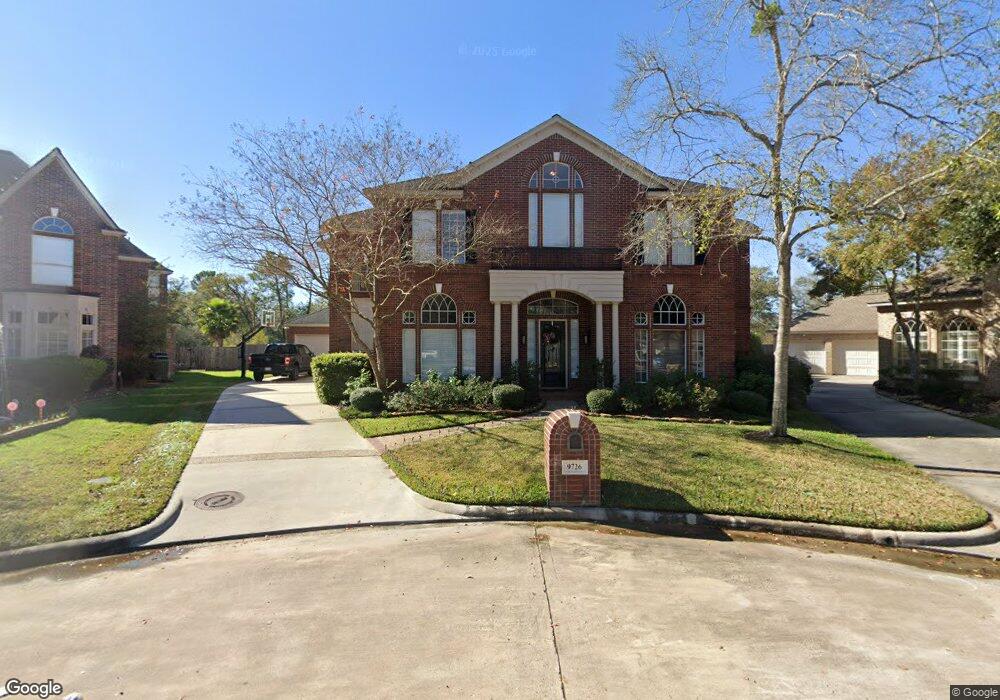
9726 Kepler Mcvey Ct Spring, TX 77379
Champions NeighborhoodEstimated Value: $605,000 - $677,000
5
Beds
5
Baths
4,274
Sq Ft
$151/Sq Ft
Est. Value
About This Home
This home is located at 9726 Kepler Mcvey Ct, Spring, TX 77379 and is currently estimated at $645,902, approximately $151 per square foot. 9726 Kepler Mcvey Ct is a home with nearby schools including Brill Elementary School, Kleb Intermediate School, and Klein High School.
Ownership History
Date
Name
Owned For
Owner Type
Purchase Details
Closed on
Jan 5, 2000
Sold by
Harper Charles J
Bought by
Rutter John E and Rutter Lisa H
Current Estimated Value
Home Financials for this Owner
Home Financials are based on the most recent Mortgage that was taken out on this home.
Original Mortgage
$340,800
Outstanding Balance
$106,490
Interest Rate
7.62%
Estimated Equity
$539,413
Purchase Details
Closed on
Apr 21, 1999
Sold by
Country Village Homes Inc
Bought by
Harper Charles J
Home Financials for this Owner
Home Financials are based on the most recent Mortgage that was taken out on this home.
Original Mortgage
$234,400
Interest Rate
7.16%
Purchase Details
Closed on
Oct 1, 1998
Sold by
B & A Realty Inc
Bought by
Country Village Homes Inc
Home Financials for this Owner
Home Financials are based on the most recent Mortgage that was taken out on this home.
Original Mortgage
$303,920
Interest Rate
6.92%
Mortgage Type
Purchase Money Mortgage
Create a Home Valuation Report for This Property
The Home Valuation Report is an in-depth analysis detailing your home's value as well as a comparison with similar homes in the area
Home Values in the Area
Average Home Value in this Area
Purchase History
| Date | Buyer | Sale Price | Title Company |
|---|---|---|---|
| Rutter John E | -- | Chicago Title | |
| Harper Charles J | -- | Alamo Title 52 | |
| Country Village Homes Inc | -- | Alamo Title 52 |
Source: Public Records
Mortgage History
| Date | Status | Borrower | Loan Amount |
|---|---|---|---|
| Open | Rutter John E | $340,800 | |
| Previous Owner | Harper Charles J | $234,400 | |
| Previous Owner | Country Village Homes Inc | $303,920 |
Source: Public Records
Tax History
| Year | Tax Paid | Tax Assessment Tax Assessment Total Assessment is a certain percentage of the fair market value that is determined by local assessors to be the total taxable value of land and additions on the property. | Land | Improvement |
|---|---|---|---|---|
| 2025 | $6,610 | $637,066 | $125,676 | $511,390 |
| 2024 | $6,610 | $644,178 | $125,676 | $518,502 |
| 2023 | $6,610 | $651,289 | $125,676 | $525,613 |
| 2022 | $11,525 | $538,170 | $125,676 | $412,494 |
| 2021 | $11,115 | $476,059 | $69,395 | $406,664 |
| 2020 | $10,587 | $430,599 | $69,395 | $361,204 |
| 2019 | $11,538 | $452,735 | $69,395 | $383,340 |
| 2018 | $6,117 | $452,735 | $69,395 | $383,340 |
| 2017 | $11,512 | $452,735 | $69,395 | $383,340 |
| 2016 | $11,512 | $452,735 | $69,395 | $383,340 |
| 2015 | $9,863 | $419,071 | $69,395 | $349,676 |
| 2014 | $9,863 | $416,255 | $69,395 | $346,860 |
Source: Public Records
Map
Nearby Homes
- 9723 Kepler Mcvey Ct
- 9707 Chipstead Cir
- 16407 Emilia Ct
- 16403 Agusta Ct
- 9911 Oxted Ln
- 9507 Godstone Ln
- 9318 Appin Falls Dr
- 16123 Chasemore Dr
- 9530 Arcade Dr
- 9727 Orangevale Dr
- 9131 Durango Point Ln
- 9414 Calwood Cir
- 16723 Scenic Gardens Dr
- 9622 Fenchurch Dr
- 9135 Solvista Pass Ln
- 9115 Monarch Mist Ln
- 9306 Stockport Dr
- 17007 Spruce Run Dr
- 9211 Godstone Ln
- 9203 Taidswood Dr
- 9722 Kepler Mcvey Ct
- 9723 Kepler Mcvey Ct
- 9719 Kepler Mcvey Ct
- 9714 Kepler Mcvey Ct
- 9706 Chipstead Cir
- 9702 Chipstead Cir
- 9710 Kepler Mcvey Ct
- 9719 Champions Cove Dr
- 9711 Kepler Mcvey Ct
- 9710 Chipstead Cir
- 9715 Champions Cove Dr
- 9706 Kepler Mcvey Ct
- 16422 Chipstead Dr
- 9711 Champions Cove Dr
- 9707 Kepler Mcvey Ct
- 9703 Chipstead Cir
- 9707 Champions Cove Dr
- 9703 Kepler Mcvey Ct
- 16418 Chipstead Dr
- 16415 Emilia Ct
Your Personal Tour Guide
Ask me questions while you tour the home.