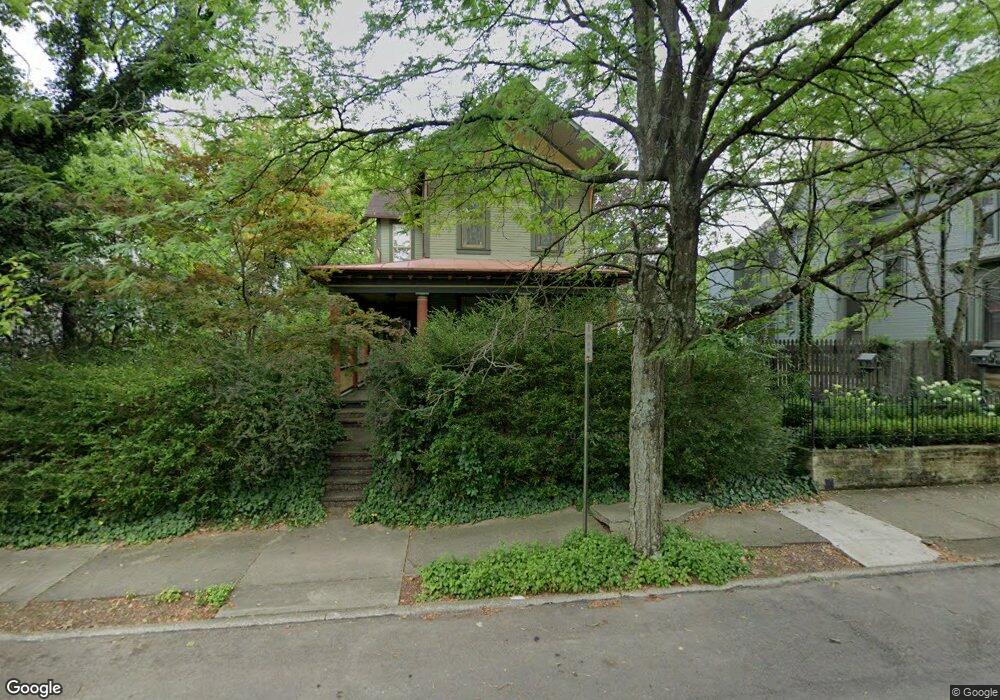
973 Franklin Ave Columbus, OH 43205
Olde Towne East NeighborhoodEstimated Value: $310,257 - $477,000
2
Beds
2
Baths
1,616
Sq Ft
$237/Sq Ft
Est. Value
About This Home
This home is located at 973 Franklin Ave, Columbus, OH 43205 and is currently estimated at $383,064, approximately $237 per square foot. 973 Franklin Ave is a home located in Franklin County with nearby schools including Ohio Avenue Elementary School, Champion Middle School, and East High School.
Ownership History
Date
Name
Owned For
Owner Type
Purchase Details
Closed on
May 29, 2007
Sold by
Seamon Michael S and Horton Todd R
Bought by
Litsky Monica L
Current Estimated Value
Home Financials for this Owner
Home Financials are based on the most recent Mortgage that was taken out on this home.
Original Mortgage
$175,500
Outstanding Balance
$107,446
Interest Rate
6.2%
Mortgage Type
Purchase Money Mortgage
Estimated Equity
$275,618
Purchase Details
Closed on
Feb 24, 2003
Sold by
Seamon Michael S
Bought by
Seamon Michael S and Horton Todd R
Home Financials for this Owner
Home Financials are based on the most recent Mortgage that was taken out on this home.
Original Mortgage
$72,000
Interest Rate
6%
Mortgage Type
Purchase Money Mortgage
Purchase Details
Closed on
Jul 17, 1997
Sold by
Puntenney Lesley
Bought by
Seamon Michael S
Home Financials for this Owner
Home Financials are based on the most recent Mortgage that was taken out on this home.
Original Mortgage
$86,500
Interest Rate
7.94%
Mortgage Type
FHA
Purchase Details
Closed on
Feb 15, 1994
Create a Home Valuation Report for This Property
The Home Valuation Report is an in-depth analysis detailing your home's value as well as a comparison with similar homes in the area
Home Values in the Area
Average Home Value in this Area
Purchase History
| Date | Buyer | Sale Price | Title Company |
|---|---|---|---|
| Litsky Monica L | $195,000 | Amerititle | |
| Seamon Michael S | $29,400 | Title First Agency Inc | |
| Seamon Michael S | $52,700 | Title First Agency Inc | |
| -- | -- | -- |
Source: Public Records
Mortgage History
| Date | Status | Borrower | Loan Amount |
|---|---|---|---|
| Open | Litsky Monica L | $175,500 | |
| Previous Owner | Seamon Michael S | $72,000 | |
| Previous Owner | Seamon Michael S | $86,500 |
Source: Public Records
Tax History Compared to Growth
Tax History
| Year | Tax Paid | Tax Assessment Tax Assessment Total Assessment is a certain percentage of the fair market value that is determined by local assessors to be the total taxable value of land and additions on the property. | Land | Improvement |
|---|---|---|---|---|
| 2024 | $4,094 | $91,220 | $40,290 | $50,930 |
| 2023 | $4,042 | $91,210 | $40,285 | $50,925 |
| 2022 | $2,890 | $55,720 | $6,510 | $49,210 |
| 2021 | $2,895 | $55,720 | $6,510 | $49,210 |
| 2020 | $2,899 | $55,720 | $6,510 | $49,210 |
| 2019 | $2,706 | $44,600 | $5,220 | $39,380 |
| 2018 | $2,801 | $44,600 | $5,220 | $39,380 |
| 2017 | $2,704 | $44,600 | $5,220 | $39,380 |
| 2016 | $3,198 | $48,270 | $5,110 | $43,160 |
| 2015 | $2,903 | $48,270 | $5,110 | $43,160 |
| 2014 | $2,910 | $48,270 | $5,110 | $43,160 |
| 2013 | $1,305 | $43,890 | $4,655 | $39,235 |
Source: Public Records
Map
Nearby Homes
- 972 Franklin Ave
- 1033-1035 Franklin Ave
- 977 Bryden Rd
- 1035 Madison Ave
- 1070 Fair Ave
- 1093 Franklin Ave
- 847 Franklin Ave
- 240-242 S 18th St
- 1095 Franklin Ave
- 263 S 20th St
- 181 S Ohio Ave
- 1096 Franklin Ave
- 1090 Fair Ave
- 1084 Bryden Rd Unit 9
- 127 S Ohio Ave Unit 19
- 122 S Ohio Ave Unit 2
- 233 S Ohio Ave Unit 11
- 308 Carpenter St
- 203-5 N 21st St Unit 203
- 269 S 17th St
- 963 Franklin Ave
- 981 Franklin Ave
- 982 Gustavus Ln
- 180 S 20th St Unit 182
- 265 S 20th St
- 182 S 20th St
- 959 Franklin Ave
- 183 S 20th St
- 183 S 20th St
- 983 Gustavus Ln
- 993 Franklin Ave
- 953 Franklin Ave
- 187 S 20th St
- 997 Franklin Ave Unit 997
- 995 Franklin Ave
- 949 Franklin Ave Unit 951
- 976 Franklin Ave Unit 978
- 191 S 20th St
- 966 Franklin Ave
- 988 Franklin Ave Unit 990