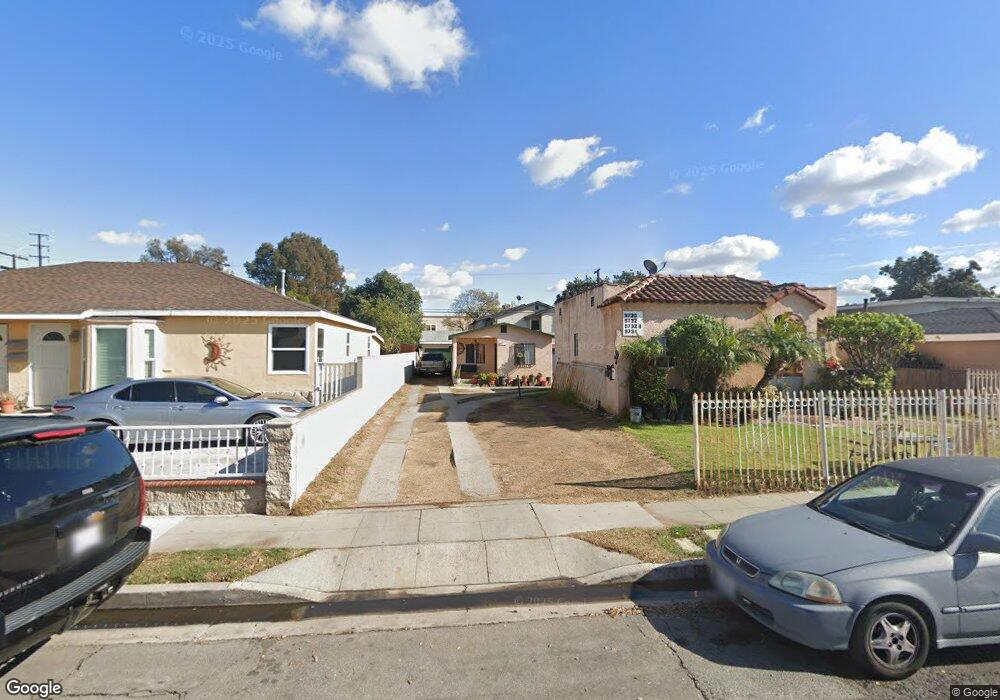
9730 Deeble St South Gate, CA 90280
Estimated Value: $778,000 - $848,000
5
Beds
3
Baths
1,847
Sq Ft
$434/Sq Ft
Est. Value
About This Home
This home is located at 9730 Deeble St, South Gate, CA 90280 and is currently estimated at $801,333, approximately $433 per square foot. 9730 Deeble St is a home located in Los Angeles County with nearby schools including Madison Elementary School, Southeast Middle School, and South Gate Middle School.
Ownership History
Date
Name
Owned For
Owner Type
Purchase Details
Closed on
Jun 11, 2002
Sold by
Hud
Bought by
Cruz Miguel and Cruz Maria J
Current Estimated Value
Home Financials for this Owner
Home Financials are based on the most recent Mortgage that was taken out on this home.
Original Mortgage
$164,000
Interest Rate
6.52%
Purchase Details
Closed on
Jul 19, 2001
Sold by
Citimortgage Inc
Bought by
Hud
Purchase Details
Closed on
Jul 18, 2001
Sold by
Sandoval Hector Rene and Sandoval Diego Rafael
Bought by
Citimortgage Inc
Purchase Details
Closed on
Jan 27, 2000
Sold by
Baker James W and Baker Orlando W
Bought by
Sandoval Hector Rene and Sandoval Diego Rafael
Home Financials for this Owner
Home Financials are based on the most recent Mortgage that was taken out on this home.
Original Mortgage
$168,610
Interest Rate
8.27%
Mortgage Type
FHA
Purchase Details
Closed on
Mar 1, 1995
Sold by
Baker Arvin W
Bought by
Roddy Anlyn W
Create a Home Valuation Report for This Property
The Home Valuation Report is an in-depth analysis detailing your home's value as well as a comparison with similar homes in the area
Home Values in the Area
Average Home Value in this Area
Purchase History
| Date | Buyer | Sale Price | Title Company |
|---|---|---|---|
| Cruz Miguel | $205,000 | Stewart Title | |
| Hud | -- | Fidelity National Title | |
| Citimortgage Inc | $182,227 | Fidelity National Title Ins | |
| Sandoval Hector Rene | $170,000 | First American Title Co | |
| Roddy Anlyn W | -- | Progressive Title Company |
Source: Public Records
Mortgage History
| Date | Status | Borrower | Loan Amount |
|---|---|---|---|
| Previous Owner | Cruz Miguel | $164,000 | |
| Previous Owner | Sandoval Hector Rene | $168,610 |
Source: Public Records
Tax History
| Year | Tax Paid | Tax Assessment Tax Assessment Total Assessment is a certain percentage of the fair market value that is determined by local assessors to be the total taxable value of land and additions on the property. | Land | Improvement |
|---|---|---|---|---|
| 2025 | $4,547 | $296,883 | $181,029 | $115,854 |
| 2024 | $4,547 | $291,063 | $177,480 | $113,583 |
| 2023 | $4,474 | $285,356 | $174,000 | $111,356 |
| 2022 | $4,285 | $279,762 | $170,589 | $109,173 |
| 2021 | $4,113 | $274,278 | $167,245 | $107,033 |
| 2020 | $4,138 | $271,467 | $165,531 | $105,936 |
| 2019 | $3,992 | $266,145 | $162,286 | $103,859 |
| 2018 | $3,834 | $260,927 | $159,104 | $101,823 |
| 2016 | $3,655 | $250,797 | $152,927 | $97,870 |
| 2015 | $3,598 | $247,030 | $150,630 | $96,400 |
| 2014 | $3,608 | $242,192 | $147,680 | $94,512 |
Source: Public Records
Map
Nearby Homes
- 10011 State St
- 3175 Ohio Ave
- 9616 Long Beach Blvd
- 9612 Long Beach Blvd
- 9826 California Ave
- 10124 Pescadero Ave
- 8995 Victoria Ave
- 3310 Cherokee Ave
- 9320 Long Beach Blvd
- 9222 California Ave
- 10025 San Anselmo Ave
- 10249 California Ave
- 3007 Sequoia Dr
- 8954 S Gate Ave
- 2913 Illinois Ave
- 9723 San Juan Ave
- 9601 San Juan Ave
- 3220 Tecumseh Ave
- 2703 Missouri Ave
- 10406 San Carlos Ave
- 9738 Deeble St
- 9722 Deeble St
- 9804 Deeble St
- 9714 Deeble St
- 9806 Deeble St
- 9733 Dearborn Ave
- 9727 Dearborn Ave
- 9739 Dearborn Ave
- 9723 Dearborn Ave
- 9812 Deeble St
- 9720 State St Unit F
- 9803 Dearborn Ave Unit 1/2
- 9803 Dearborn Ave
- 9706 Deeble St
- 9816 Deeble St
- 9809 Dearborn Ave Unit C
- 9711 Dearborn Ave
- 9707 Deeble St
- 9820 Deeble St
- 9707 Dearborn Ave