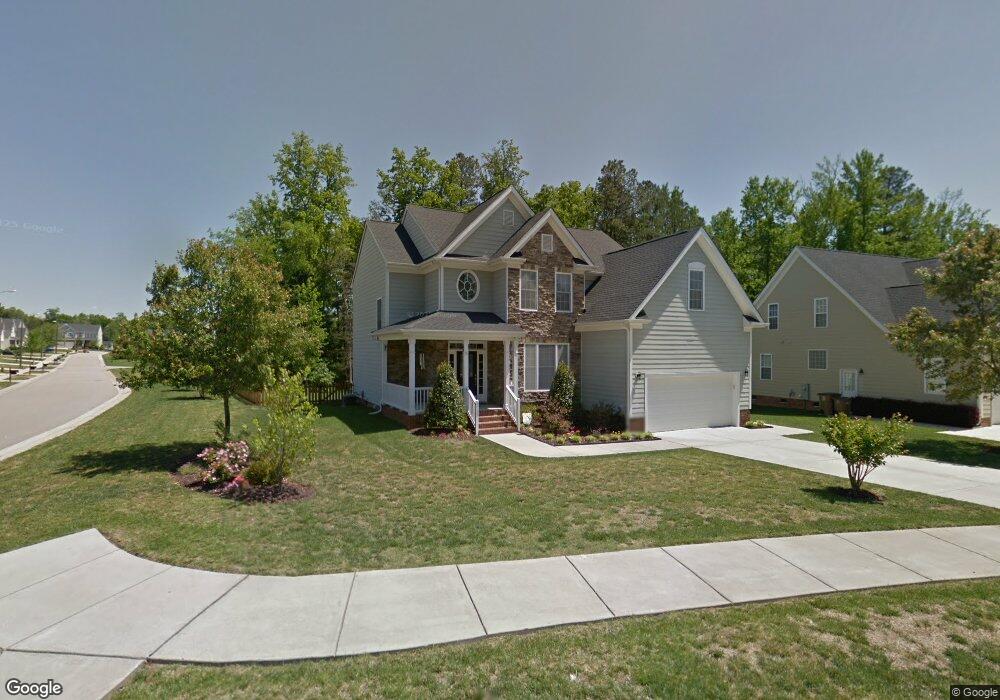
9732 Rainsong Dr Wake Forest, NC 27587
Estimated Value: $503,000 - $518,000
4
Beds
3
Baths
2,702
Sq Ft
$189/Sq Ft
Est. Value
About This Home
This home is located at 9732 Rainsong Dr, Wake Forest, NC 27587 and is currently estimated at $511,583, approximately $189 per square foot. 9732 Rainsong Dr is a home located in Wake County with nearby schools including Sanford Creek Elementary School, Wake Forest-Rolesville Middle School, and Wake Forest High School.
Ownership History
Date
Name
Owned For
Owner Type
Purchase Details
Closed on
Apr 1, 2013
Sold by
Kozink Rachel V and Kozink Daniel M
Bought by
Bland Tamara A
Current Estimated Value
Home Financials for this Owner
Home Financials are based on the most recent Mortgage that was taken out on this home.
Original Mortgage
$252,345
Outstanding Balance
$176,335
Interest Rate
3.25%
Mortgage Type
FHA
Estimated Equity
$335,248
Purchase Details
Closed on
Oct 27, 2005
Sold by
Perry Builders Llc
Bought by
Kozink Daniel M and Kozink Rachel
Home Financials for this Owner
Home Financials are based on the most recent Mortgage that was taken out on this home.
Original Mortgage
$155,000
Interest Rate
5.71%
Mortgage Type
Fannie Mae Freddie Mac
Purchase Details
Closed on
Feb 17, 2005
Sold by
Murdock & Gannon Construction Inc
Bought by
Perry Builders Llc
Create a Home Valuation Report for This Property
The Home Valuation Report is an in-depth analysis detailing your home's value as well as a comparison with similar homes in the area
Home Values in the Area
Average Home Value in this Area
Purchase History
| Date | Buyer | Sale Price | Title Company |
|---|---|---|---|
| Bland Tamara A | $257,000 | None Available | |
| Kozink Daniel M | $297,000 | None Available | |
| Perry Builders Llc | $45,000 | -- |
Source: Public Records
Mortgage History
| Date | Status | Borrower | Loan Amount |
|---|---|---|---|
| Open | Bland Tamara A | $252,345 | |
| Previous Owner | Kozink Daniel M | $155,000 |
Source: Public Records
Tax History Compared to Growth
Tax History
| Year | Tax Paid | Tax Assessment Tax Assessment Total Assessment is a certain percentage of the fair market value that is determined by local assessors to be the total taxable value of land and additions on the property. | Land | Improvement |
|---|---|---|---|---|
| 2025 | $4,714 | $487,973 | $105,000 | $382,973 |
| 2024 | $4,696 | $487,973 | $105,000 | $382,973 |
| 2023 | $3,750 | $320,961 | $57,000 | $263,961 |
| 2022 | $3,597 | $320,961 | $57,000 | $263,961 |
| 2021 | $3,535 | $320,961 | $57,000 | $263,961 |
| 2020 | $3,535 | $320,961 | $57,000 | $263,961 |
| 2019 | $3,357 | $268,930 | $57,000 | $211,930 |
| 2018 | $3,178 | $268,930 | $57,000 | $211,930 |
| 2017 | $3,072 | $268,930 | $57,000 | $211,930 |
| 2016 | $3,033 | $268,930 | $57,000 | $211,930 |
| 2015 | $3,436 | $301,087 | $60,000 | $241,087 |
| 2014 | $3,326 | $301,087 | $60,000 | $241,087 |
Source: Public Records
Map
Nearby Homes
- 4208 Tain Burgh Ct
- 4438 Hillsgrove Rd
- 4302 Hillsgrove Rd
- 4205 Ginger Sprout Dr
- 8330 Bratt Ave
- 8334 Bratt Ave
- 3100 Lariat Ridge Dr
- 2913 Thurman Dairy Loop
- 8520 Bratt Ave
- 8911 Elizabeth Benneth Place
- 3100 Countryman Ct
- JONATHAN Plan at Thornton Townes
- SYDNEY Plan at Thornton Townes
- 3037 Thurman Dairy Loop
- 8857 Thornton Town Place
- 5313 Neuse Forest Rd
- 5163 Sandy Banks Rd
- 8537 Beckett Chase Way
- 8535 Beckett Chase Way
- 8531 Beckett Chase Way
- 9732 Rainsong St
- 9728 Rainsong Dr
- 9724 Rainsong Dr
- 4436 Overglen Ave
- 4432 Overglen Ave
- 9729 Corktree Ct
- 9725 Corktree Ct
- 9737 Rainsong Dr
- 4428 Overglen Ave
- 9731 Corktree Ct
- 9741 Rainsong St
- 9720 Rainsong Dr
- 9721 Corktree Ct
- 9733 Rainsong Dr
- 9737 Rainsong Dr
- 4424 Overglen Ave
- 9729 Rainsong Dr
- 9741 Rainsong Dr
- 9717 Corktree Ct
- 9716 Rainsong Dr