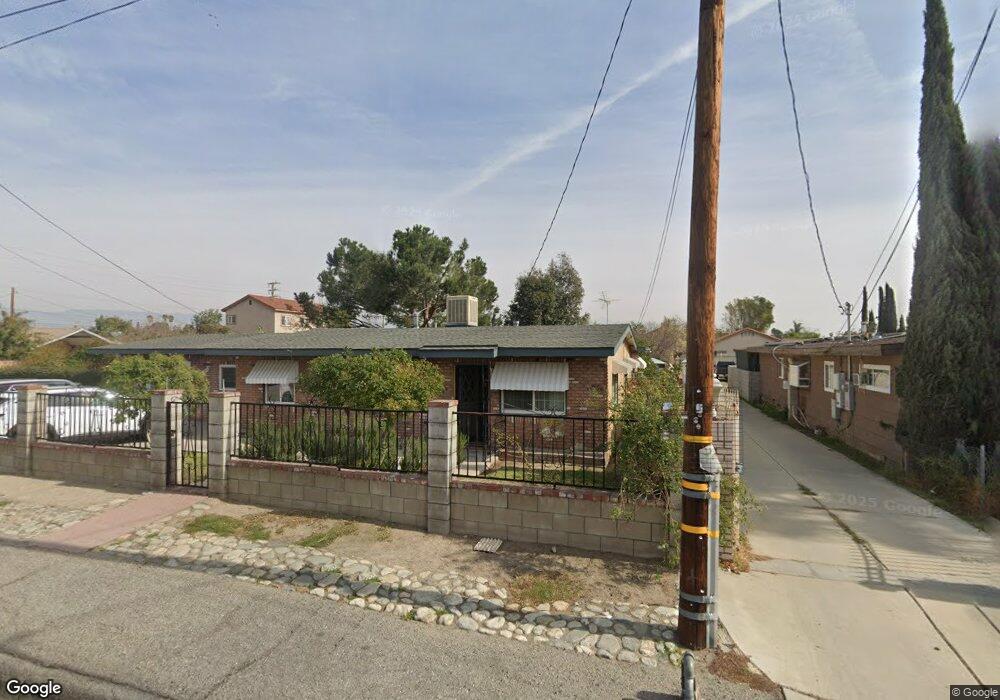
9735 Linden Ave Bloomington, CA 92316
Estimated Value: $539,000 - $671,000
3
Beds
1
Bath
1,508
Sq Ft
$384/Sq Ft
Est. Value
About This Home
This home is located at 9735 Linden Ave, Bloomington, CA 92316 and is currently estimated at $579,517, approximately $384 per square foot. 9735 Linden Ave is a home located in San Bernardino County with nearby schools including Gerald A. Smith Elementary School, Joe Baca, and Bloomington High School.
Ownership History
Date
Name
Owned For
Owner Type
Purchase Details
Closed on
Jul 28, 2020
Sold by
Monarez Arely
Bought by
Monarez Arely and Cundiff Joseph Alan
Current Estimated Value
Purchase Details
Closed on
Aug 11, 2011
Sold by
Jimenez Juan
Bought by
Monarez Arely
Purchase Details
Closed on
Jul 25, 2005
Sold by
Jimenez Juan
Bought by
Jimenez Juan and The Jimenez Revocable Living T
Purchase Details
Closed on
Jun 5, 1997
Sold by
Lopez Fermin
Bought by
Federal National Mortgage Association
Purchase Details
Closed on
Apr 19, 1995
Sold by
Federal National Mortgage Association
Bought by
Lopez Fermin
Home Financials for this Owner
Home Financials are based on the most recent Mortgage that was taken out on this home.
Original Mortgage
$106,700
Interest Rate
7.25%
Mortgage Type
Seller Take Back
Purchase Details
Closed on
Feb 13, 1995
Sold by
Magana Teresa
Bought by
Federal National Mortgage Association
Create a Home Valuation Report for This Property
The Home Valuation Report is an in-depth analysis detailing your home's value as well as a comparison with similar homes in the area
Home Values in the Area
Average Home Value in this Area
Purchase History
| Date | Buyer | Sale Price | Title Company |
|---|---|---|---|
| Monarez Arely | -- | None Available | |
| Monarez Arely | -- | None Available | |
| Jimenez Juan | -- | None Available | |
| Jimenez Juan | -- | -- | |
| Federal National Mortgage Association | $74,100 | Chicago Title Co | |
| Lopez Fermin | $110,000 | Fidelity National Title Ins | |
| Federal National Mortgage Association | $119,000 | Stewart Title |
Source: Public Records
Mortgage History
| Date | Status | Borrower | Loan Amount |
|---|---|---|---|
| Previous Owner | Lopez Fermin | $106,700 |
Source: Public Records
Tax History
| Year | Tax Paid | Tax Assessment Tax Assessment Total Assessment is a certain percentage of the fair market value that is determined by local assessors to be the total taxable value of land and additions on the property. | Land | Improvement |
|---|---|---|---|---|
| 2025 | $2,374 | $175,849 | $62,803 | $113,046 |
| 2024 | $2,268 | $172,401 | $61,572 | $110,829 |
| 2023 | $2,268 | $169,021 | $60,365 | $108,656 |
| 2022 | $2,233 | $165,706 | $59,181 | $106,525 |
| 2021 | $2,271 | $162,457 | $58,021 | $104,436 |
| 2020 | $2,276 | $160,791 | $57,426 | $103,365 |
| 2019 | $2,218 | $157,638 | $56,300 | $101,338 |
| 2018 | $2,027 | $154,547 | $55,196 | $99,351 |
| 2017 | $1,956 | $151,517 | $54,114 | $97,403 |
| 2016 | $2,006 | $148,546 | $53,053 | $95,493 |
| 2015 | $1,942 | $146,315 | $52,256 | $94,059 |
| 2014 | $1,869 | $143,449 | $51,232 | $92,217 |
Source: Public Records
Map
Nearby Homes
- 9824 Linden Ave
- 18325 El Molino St
- 18605 Sequoia Ave
- 18793 San Bernardino Ave
- 18251 Marygold Ave
- 9416 Cedar Ave
- 18411 Valley Blvd
- 18411 Valley Blvd Unit 64
- 18411 Valley Blvd Unit 39
- 18411 Valley Blvd Unit 56
- 839 S Aspen Ave
- 9454 Frankfort Ave
- 18316 W Hawthorne St
- 9431 Laurel Ave
- 1459 W James St
- 9050 Dumond Dr
- 778 Bloomington Ave
- 9873 Alder Ave Unit 32
- 9873 Alder Ave Unit 4
- 17860 Taylor Ave
- 9743 Linden Ave
- 9711 Linden Ave
- 9740 Linden Ave
- 9750 Linden Ave
- 9761 Linden Ave
- 9730 Linden Ave
- 9760 Linden Ave
- 18541 Avion Ln
- 9720 Linden Ave
- 18536 Avion Ln
- 9770 Linden Ave
- 9727 Ironwood Ave
- 9739 Ironwood Ave
- 18546 Mardel Ln
- 9751 Ironwood Ave
- 18512 El Molino St
- 18553 Avion Ln
- 18524 El Molino St
- 18548 Avion Ln
- 9780 Linden Ave
Your Personal Tour Guide
Ask me questions while you tour the home.