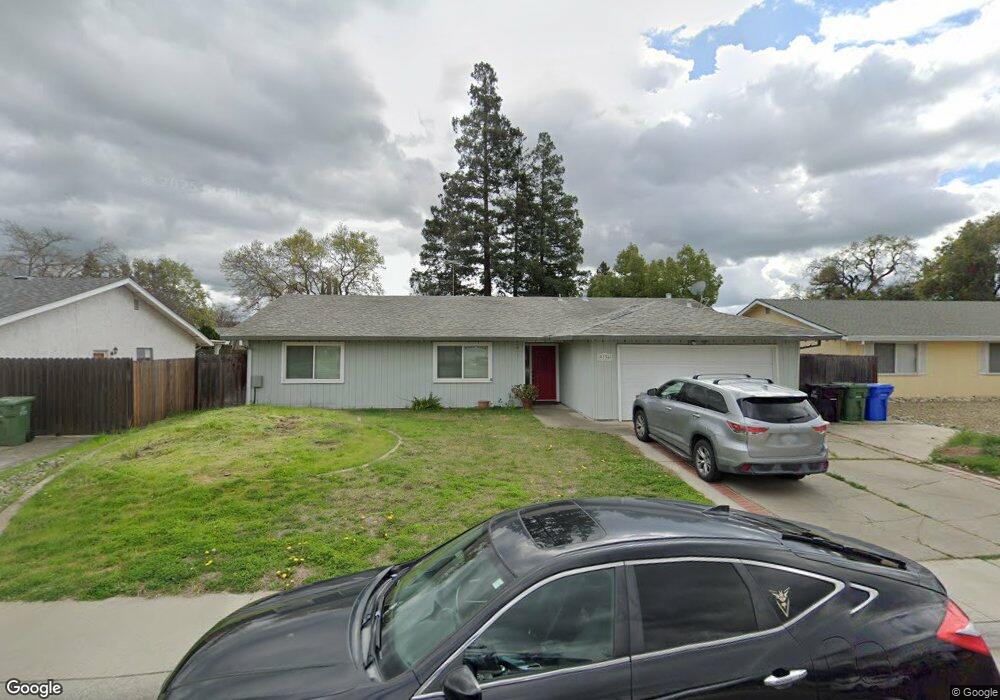
9736 Tralee Way Elk Grove, CA 95624
South East Elk Grove NeighborhoodEstimated Value: $358,000 - $543,000
3
Beds
2
Baths
1,474
Sq Ft
$329/Sq Ft
Est. Value
About This Home
This home is located at 9736 Tralee Way, Elk Grove, CA 95624 and is currently estimated at $484,627, approximately $328 per square foot. 9736 Tralee Way is a home located in Sacramento County with nearby schools including Florence Markofer Elementary School, Joseph Kerr Middle School, and Elk Grove High School.
Ownership History
Date
Name
Owned For
Owner Type
Purchase Details
Closed on
Aug 25, 2010
Sold by
Maita Cheryle
Bought by
Maita Nicholas R
Current Estimated Value
Home Financials for this Owner
Home Financials are based on the most recent Mortgage that was taken out on this home.
Original Mortgage
$186,499
Outstanding Balance
$125,810
Interest Rate
4.87%
Mortgage Type
FHA
Estimated Equity
$358,817
Purchase Details
Closed on
Jul 21, 2010
Sold by
Wells Fargo Bank Na
Bought by
Malta Nicholas R
Home Financials for this Owner
Home Financials are based on the most recent Mortgage that was taken out on this home.
Original Mortgage
$186,499
Outstanding Balance
$125,810
Interest Rate
4.87%
Mortgage Type
FHA
Estimated Equity
$358,817
Purchase Details
Closed on
Jan 14, 2010
Sold by
Myers Joel S and Myers Sandra L
Bought by
Wells Fargo Bank Na
Create a Home Valuation Report for This Property
The Home Valuation Report is an in-depth analysis detailing your home's value as well as a comparison with similar homes in the area
Home Values in the Area
Average Home Value in this Area
Purchase History
| Date | Buyer | Sale Price | Title Company |
|---|---|---|---|
| Maita Nicholas R | -- | Fidelity National Title Co | |
| Malta Nicholas R | $170,000 | Fidelity National Title Co | |
| Wells Fargo Bank Na | $195,000 | Servicelink |
Source: Public Records
Mortgage History
| Date | Status | Borrower | Loan Amount |
|---|---|---|---|
| Open | Maita Nicholas R | $186,499 |
Source: Public Records
Tax History Compared to Growth
Tax History
| Year | Tax Paid | Tax Assessment Tax Assessment Total Assessment is a certain percentage of the fair market value that is determined by local assessors to be the total taxable value of land and additions on the property. | Land | Improvement |
|---|---|---|---|---|
| 2025 | $4,574 | $217,787 | $96,082 | $121,705 |
| 2024 | $4,574 | $213,518 | $94,199 | $119,319 |
| 2023 | $4,378 | $209,332 | $92,352 | $116,980 |
| 2022 | $3,766 | $205,229 | $90,542 | $114,687 |
| 2021 | $2,867 | $201,206 | $88,767 | $112,439 |
| 2020 | $2,271 | $199,144 | $87,857 | $111,287 |
| 2019 | $3,300 | $195,240 | $86,135 | $109,105 |
| 2018 | $2,607 | $191,413 | $84,447 | $106,966 |
| 2017 | $2,129 | $187,661 | $82,792 | $104,869 |
| 2016 | $2,022 | $183,982 | $81,169 | $102,813 |
| 2015 | $1,984 | $181,219 | $79,950 | $101,269 |
| 2014 | $1,951 | $177,670 | $78,384 | $99,286 |
Source: Public Records
Map
Nearby Homes
- 9706 Parktree Way
- 9684 Gage St
- 9648 La Nuez Dr
- 25 Calle Susana
- 30 Calle Susana
- 15 Calle Margarita
- 9550 Colton Ave
- 135 Calle Maria
- 97 Calle Anta
- 1 Calle Margarita
- 76 Calle Arboleda
- 8770 Superb Cir
- 8977 E Valley Dr
- 8618 Litz Brothers Way
- 9497 Sara St
- 8804 On Ct
- 10349 Charles Morris Way
- 9552 Porto Rosa Dr
- 8896 Kelsey Dr
- 1 Lotz Pkwy
- 9730 Tralee Way
- 9742 Tralee Way
- 8943 Clancys Ct
- 8949 Clancys Ct
- 8937 Clancys Ct
- 9724 Tralee Way
- 9737 Tralee Way
- 9731 Tralee Way
- 9743 Tralee Way
- 8931 Clancys Ct
- 9725 Tralee Way
- 9718 Tralee Way
- 9719 Tralee Way
- 8942 Clancys Ct
- 8925 Clancys Ct
- 8948 Clancys Ct
- 8936 Clancys Ct
- 9712 Tralee Way
- 8930 Clancys Ct
- 9713 Tralee Way