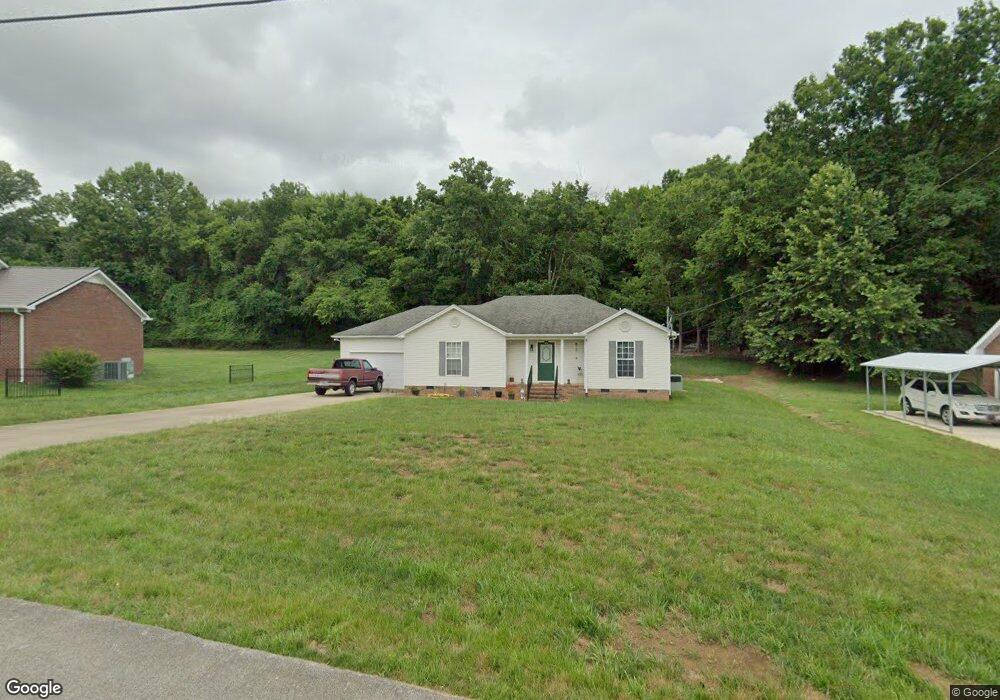
974 Foxboro Dr Lewisburg, TN 37091
Estimated Value: $240,617 - $301,000
--
Bed
2
Baths
1,321
Sq Ft
$211/Sq Ft
Est. Value
About This Home
This home is located at 974 Foxboro Dr, Lewisburg, TN 37091 and is currently estimated at $278,404, approximately $210 per square foot. 974 Foxboro Dr is a home located in Marshall County with nearby schools including Marshall Elementary School, Oak Grove Elementary School, and Westhills Elementary School.
Ownership History
Date
Name
Owned For
Owner Type
Purchase Details
Closed on
Jan 14, 2010
Sold by
Hsbc Mortgage Services
Bought by
Brooks Eddy D
Current Estimated Value
Purchase Details
Closed on
Oct 9, 2009
Sold by
Bennett William T
Bought by
Hsbc Mortgage Services
Purchase Details
Closed on
Jul 28, 2006
Sold by
Orr Steven R
Bought by
William Bennett and William Shallin
Purchase Details
Closed on
Jul 19, 2002
Sold by
Keith Hooten and Keith Mindy
Bought by
Orr Steven R
Purchase Details
Closed on
Jul 18, 2002
Bought by
Orr Steven R
Purchase Details
Closed on
Mar 4, 2002
Sold by
Ricky Farmer and Ricky Cindy
Bought by
Keith Hooten
Purchase Details
Closed on
Mar 9, 2000
Sold by
T B C Land Investment
Bought by
Ricky Farmer and Ricky Cindy
Purchase Details
Closed on
Jun 21, 1989
Bought by
T B C Land Investment And Development Co
Create a Home Valuation Report for This Property
The Home Valuation Report is an in-depth analysis detailing your home's value as well as a comparison with similar homes in the area
Home Values in the Area
Average Home Value in this Area
Purchase History
| Date | Buyer | Sale Price | Title Company |
|---|---|---|---|
| Brooks Eddy D | $92,000 | -- | |
| Hsbc Mortgage Services | $70,561 | -- | |
| William Bennett | $109,000 | -- | |
| Orr Steven R | $89,610 | -- | |
| Orr Steven R | $89,610 | -- | |
| Keith Hooten | $10,600 | -- | |
| Ricky Farmer | $11,200 | -- | |
| T B C Land Investment And Development Co | $500,000 | -- |
Source: Public Records
Tax History Compared to Growth
Tax History
| Year | Tax Paid | Tax Assessment Tax Assessment Total Assessment is a certain percentage of the fair market value that is determined by local assessors to be the total taxable value of land and additions on the property. | Land | Improvement |
|---|---|---|---|---|
| 2024 | -- | $49,150 | $6,250 | $42,900 |
| 2023 | $1,526 | $49,150 | $6,250 | $42,900 |
| 2022 | $1,526 | $49,150 | $6,250 | $42,900 |
| 2021 | $1,411 | $30,325 | $4,500 | $25,825 |
| 2020 | $1,330 | $30,325 | $4,500 | $25,825 |
| 2019 | $1,288 | $28,600 | $4,500 | $24,100 |
| 2018 | $1,274 | $28,600 | $4,500 | $24,100 |
| 2017 | $1,274 | $28,600 | $4,500 | $24,100 |
| 2016 | $1,279 | $24,975 | $3,750 | $21,225 |
| 2015 | $1,166 | $24,975 | $3,750 | $21,225 |
| 2014 | $1,166 | $24,975 | $3,750 | $21,225 |
Source: Public Records
Map
Nearby Homes
- 1020 Corey Dr
- 1159 White Dr
- 795 Ashwood Ave
- 1151 Green Valley Dr
- 718 Midway St
- 977 Galloway St
- 601 Joyce Ave
- 1011 Cornersville Rd
- 966 Berry St
- 1505 Sandy St
- 575 Joyce Cir
- 1821 Gina Lynn Dr
- 0 Joyce Ave
- 632 Colburn Dr
- 1128 Moreno Ln
- 750 Lakehill Cir
- 1205 Maelee Ann Dr
- 640 6th Ave S
- 185 Southview Dr
- 198 Southview Dr