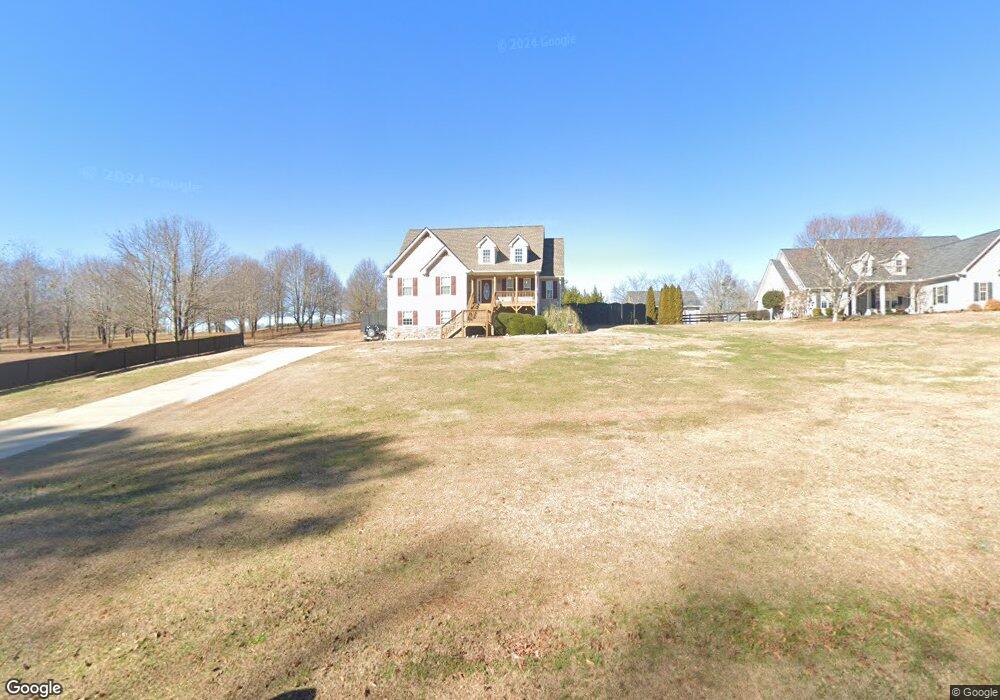
974 Honeysuckle Ln Temple, GA 30179
Estimated Value: $321,430 - $440,000
4
Beds
2
Baths
1,610
Sq Ft
$225/Sq Ft
Est. Value
About This Home
This home is located at 974 Honeysuckle Ln, Temple, GA 30179 and is currently estimated at $361,608, approximately $224 per square foot. 974 Honeysuckle Ln is a home located in Paulding County with nearby schools including Union Elementary School, Carl Scoggins Sr. Middle School, and South Paulding High School.
Ownership History
Date
Name
Owned For
Owner Type
Purchase Details
Closed on
Sep 26, 2017
Sold by
Not Provided
Current Estimated Value
Purchase Details
Closed on
Apr 12, 2010
Sold by
Davidson Donald G and Davidson Deborah R
Bought by
Yarbrough Sheryl
Home Financials for this Owner
Home Financials are based on the most recent Mortgage that was taken out on this home.
Original Mortgage
$146,301
Interest Rate
4.87%
Mortgage Type
FHA
Purchase Details
Closed on
Jan 18, 2008
Sold by
Turn-Key Builders Inc
Bought by
Davidson Donald G
Home Financials for this Owner
Home Financials are based on the most recent Mortgage that was taken out on this home.
Original Mortgage
$127,200
Interest Rate
6.06%
Mortgage Type
New Conventional
Create a Home Valuation Report for This Property
The Home Valuation Report is an in-depth analysis detailing your home's value as well as a comparison with similar homes in the area
Home Values in the Area
Average Home Value in this Area
Purchase History
| Date | Buyer | Sale Price | Title Company |
|---|---|---|---|
| -- | $1,780,000 | -- | |
| Yarbrough Sheryl | $149,000 | -- | |
| Davidson Donald G | $159,000 | -- |
Source: Public Records
Mortgage History
| Date | Status | Borrower | Loan Amount |
|---|---|---|---|
| Previous Owner | Yarbrough Sheryl | $146,301 | |
| Previous Owner | Davidson Donald G | $127,200 |
Source: Public Records
Tax History Compared to Growth
Tax History
| Year | Tax Paid | Tax Assessment Tax Assessment Total Assessment is a certain percentage of the fair market value that is determined by local assessors to be the total taxable value of land and additions on the property. | Land | Improvement |
|---|---|---|---|---|
| 2024 | $3,453 | $138,808 | $10,120 | $128,688 |
| 2023 | $3,442 | $132,012 | $9,600 | $122,412 |
| 2022 | $3,088 | $118,464 | $9,520 | $108,944 |
| 2021 | $2,839 | $97,708 | $6,800 | $90,908 |
| 2020 | $2,817 | $94,840 | $5,800 | $89,040 |
| 2019 | $2,583 | $85,716 | $5,040 | $80,676 |
| 2018 | $2,353 | $78,084 | $5,240 | $72,844 |
| 2017 | $2,248 | $73,572 | $5,240 | $68,332 |
| 2016 | $1,864 | $61,636 | $5,640 | $55,996 |
| 2015 | $1,765 | $57,360 | $5,640 | $51,720 |
| 2014 | $1,506 | $47,724 | $4,840 | $42,884 |
| 2013 | -- | $36,160 | $4,800 | $31,360 |
Source: Public Records
Map
Nearby Homes
- 689 Hardin Rd
- 10331 Buchanan Hwy
- 11070 Buchanan Hwy
- 162 Faithful Dr
- 957 Georgia 101
- 959 Georgia 101
- 138 W Fork Way
- 221 Pleasant Way
- 460 Pleasant Way
- 207 Ivey Terrace
- 207 Ivey Terrace Unit 27
- 209 Ivey Terrace Unit 28
- 209 Ivey Terrace
- 211 Ivey Terrace
- 211 Ivey Terrace Unit 29
- 213 Ivey Terrace
- 213 Ivey Terrace Unit 30
- 215 Ivey Terrace
- 217 Ivey Terrace Unit 32
- 217 Ivey Terrace
- 930 Honeysuckle Ln
- 988 Honeysuckle Ln
- 971 Honeysuckle Ln
- 1030 Honeysuckle Ln
- 28 Carter Creek Dr
- 1054 Honeysuckle Ln
- 21 Carter Creek Dr
- 43 Carter Creek Dr
- 76 Carter Creek Dr
- 61 Carter Creek Dr Unit 4
- 61 Carter Creek Dr
- 94 Carter Creek Dr
- 877 Honeysuckle Ln
- 79 Carter Creek Dr
- 805 Baskin Rd
- 97 Carter Creek Dr
- 116 Carter Creek Dr
- 1096 Honeysuckle Ln
- 845 Honeysuckle Ln
- 920 Honeysuckle Ln