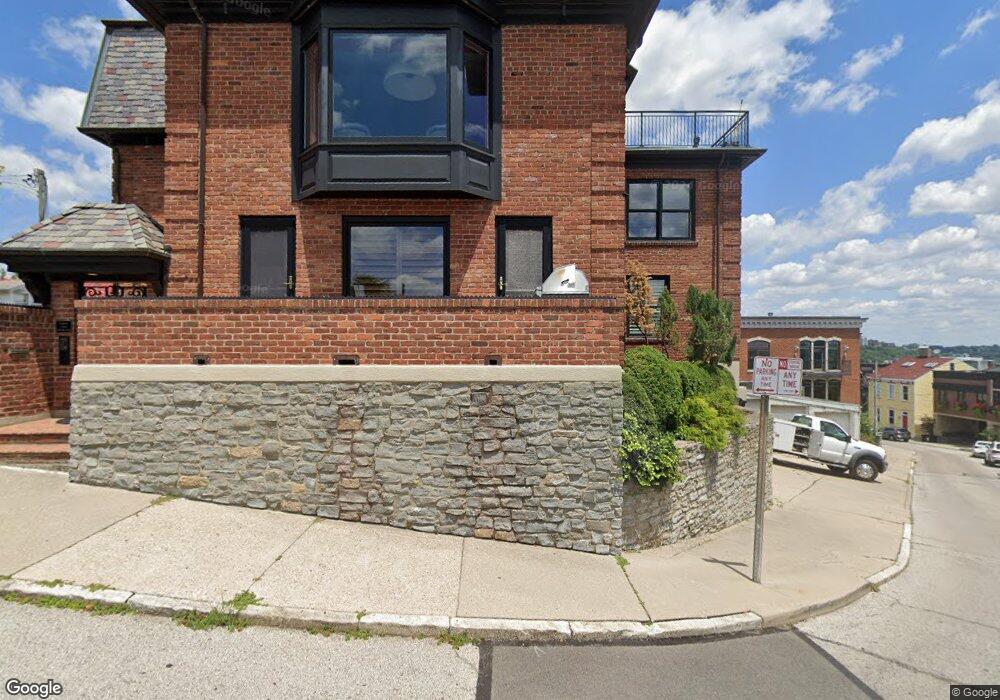
974 Pavilion St Cincinnati, OH 45202
Mount Adams NeighborhoodEstimated Value: $1,920,000 - $2,081,970
3
Beds
6
Baths
4,893
Sq Ft
$406/Sq Ft
Est. Value
About This Home
This home is located at 974 Pavilion St, Cincinnati, OH 45202 and is currently estimated at $1,986,323, approximately $405 per square foot. 974 Pavilion St is a home located in Hamilton County with nearby schools including Robert A. Taft Information Technology High School, Withrow University High School, and Clark Montessori High School.
Ownership History
Date
Name
Owned For
Owner Type
Purchase Details
Closed on
Dec 31, 2019
Sold by
Homan Laura A
Bought by
Homan Walter E
Current Estimated Value
Purchase Details
Closed on
Feb 2, 2004
Sold by
Wersching James P
Bought by
Homan Walter E and Homan Laura A
Purchase Details
Closed on
Jan 2, 2002
Sold by
Breen Michelle C
Bought by
Breen Donald
Purchase Details
Closed on
Jul 6, 2000
Sold by
Pietrandrea Beth L
Bought by
Breen Donald and Breen Michelle C
Home Financials for this Owner
Home Financials are based on the most recent Mortgage that was taken out on this home.
Original Mortgage
$450,000
Interest Rate
8.12%
Mortgage Type
Unknown
Purchase Details
Closed on
Aug 27, 1994
Sold by
Gordon Jerome A and Gordon Madeleine H
Bought by
Niehoff K Richard B and Niehoff Nancy J
Purchase Details
Closed on
Aug 15, 1994
Sold by
Meranus Leonard S
Bought by
Gordon Jerome A and Gordon Madeleine H
Create a Home Valuation Report for This Property
The Home Valuation Report is an in-depth analysis detailing your home's value as well as a comparison with similar homes in the area
Home Values in the Area
Average Home Value in this Area
Purchase History
| Date | Buyer | Sale Price | Title Company |
|---|---|---|---|
| Homan Walter E | -- | None Available | |
| Homan Walter E | -- | -- | |
| Wersching James P | -- | -- | |
| Gh & R Business Services Inc | -- | -- | |
| Breen Donald | -- | -- | |
| Breen Donald | -- | -- | |
| Pietrandrea Beth L | $1,070,000 | -- | |
| Niehoff K Richard B | -- | -- | |
| Gordon Jerome A | -- | -- |
Source: Public Records
Mortgage History
| Date | Status | Borrower | Loan Amount |
|---|---|---|---|
| Previous Owner | Pietrandrea Beth L | $450,000 |
Source: Public Records
Tax History
| Year | Tax Paid | Tax Assessment Tax Assessment Total Assessment is a certain percentage of the fair market value that is determined by local assessors to be the total taxable value of land and additions on the property. | Land | Improvement |
|---|---|---|---|---|
| 2025 | $37,314 | $606,323 | $131,240 | $475,083 |
| 2024 | $36,186 | $606,323 | $131,240 | $475,083 |
| 2023 | $37,000 | $606,323 | $131,240 | $475,083 |
| 2022 | $30,580 | $449,394 | $126,466 | $322,928 |
| 2021 | $29,440 | $449,394 | $126,466 | $322,928 |
| 2020 | $30,300 | $449,394 | $126,466 | $322,928 |
| 2019 | $31,246 | $409,955 | $119,308 | $290,647 |
| 2018 | $30,262 | $409,955 | $119,308 | $290,647 |
| 2017 | $28,752 | $409,955 | $119,308 | $290,647 |
| 2016 | $28,492 | $400,527 | $115,728 | $284,799 |
| 2015 | $25,683 | $400,527 | $115,728 | $284,799 |
| 2014 | $25,866 | $400,527 | $115,728 | $284,799 |
| 2013 | $27,131 | $412,916 | $119,308 | $293,608 |
Source: Public Records
Map
Nearby Homes
- 1112 Fuller St
- 1120 Fuller St
- 949 Pavilion St
- 961 Hatch St
- 982 Hatch St
- 1054 Saint Paul Place
- 1000 Paradrome St
- 1040 Hatch St
- 989 Parkside Place
- 971 Parkside Place
- 330 Oregon St
- 327 Oregon St
- 325 Oregon St
- 341 Oregon St
- 380 Baum St
- 380 Baum St Unit 5B
- 1238 Elsinore Ave
- 310 Oregon St
- 328 Oregon St
- 375 Oregon St
- 1104 Fuller St
- 1106 Fuller St
- 1109 Carney St
- 1108 Fuller St
- 1105 Fuller St
- 966 Pavilion St Unit 5
- 966 Pavilion St Unit 3
- 966 Pavilion St
- 966 Pavilion St
- 966 Pavilion St Unit 1
- 966 Pavilion St Unit 2
- 1110 Fuller St
- 1111 Carney St
- 964 Pavilion St
- 964 Pavilion St Unit SI ID1056076P
- 964 Pavilion St Unit SI ID1056060P
- 964 Pavilion St Unit SI ID1397242P
- 964 Pavilion St Unit ID1397242P
- 964 Pavilion St Unit ID1056076P
- 964 Pavilion St Unit ID1056060P
Your Personal Tour Guide
Ask me questions while you tour the home.