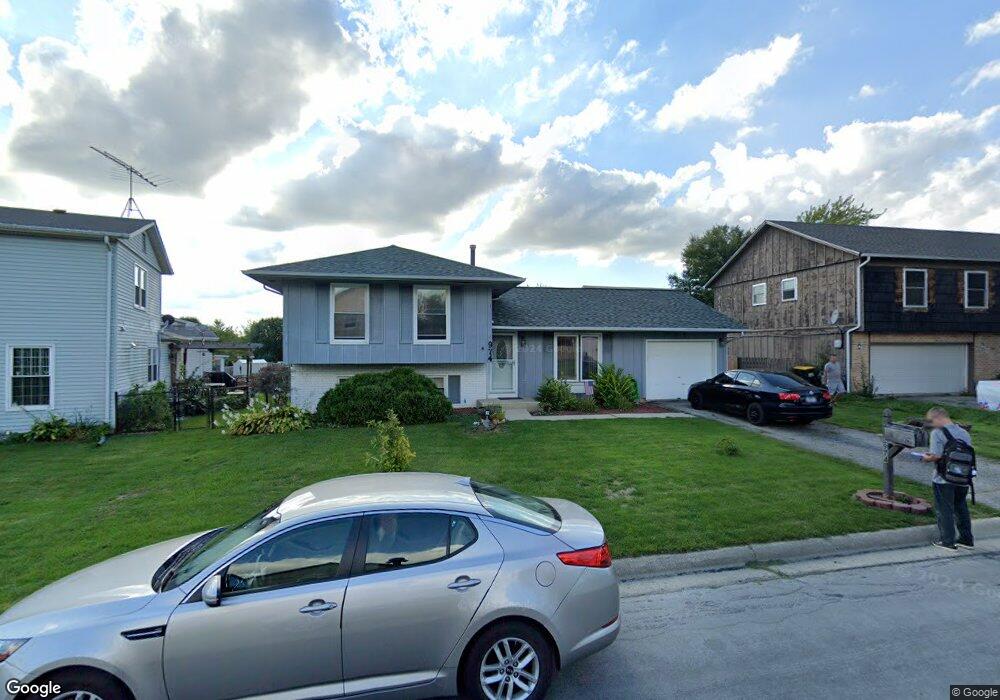
974 Tioga Ct Unit 6 Carol Stream, IL 60188
Estimated Value: $355,000 - $392,000
3
Beds
2
Baths
1,462
Sq Ft
$251/Sq Ft
Est. Value
About This Home
This home is located at 974 Tioga Ct Unit 6, Carol Stream, IL 60188 and is currently estimated at $367,057, approximately $251 per square foot. 974 Tioga Ct Unit 6 is a home located in DuPage County with nearby schools including Field Kindergarten Center, Western Trails Elementary School, and Jay Stream Middle School.
Ownership History
Date
Name
Owned For
Owner Type
Purchase Details
Closed on
Mar 26, 2021
Sold by
Oukrust Jimmy and Taylor Amanda
Bought by
Oukrust Jimmy
Current Estimated Value
Home Financials for this Owner
Home Financials are based on the most recent Mortgage that was taken out on this home.
Original Mortgage
$160,000
Interest Rate
3.5%
Mortgage Type
New Conventional
Purchase Details
Closed on
Apr 8, 2011
Sold by
Mazgola Ryszard
Bought by
Oukrust Jimmy and Taylor Amanda
Home Financials for this Owner
Home Financials are based on the most recent Mortgage that was taken out on this home.
Original Mortgage
$162,761
Interest Rate
5.25%
Mortgage Type
FHA
Purchase Details
Closed on
Nov 16, 2010
Sold by
Federal Home Loan Mortgage Corporation
Bought by
Mazgola Ryszard
Purchase Details
Closed on
Aug 11, 2010
Sold by
Clark Earl J
Bought by
Federal Home Loan Mortgage Corp
Create a Home Valuation Report for This Property
The Home Valuation Report is an in-depth analysis detailing your home's value as well as a comparison with similar homes in the area
Home Values in the Area
Average Home Value in this Area
Purchase History
| Date | Buyer | Sale Price | Title Company |
|---|---|---|---|
| Oukrust Jimmy | -- | First American Title | |
| Oukrust Jimmy | $167,000 | Alliance Title Corporation | |
| Mazgola Ryszard | $117,000 | Atg | |
| Federal Home Loan Mortgage Corp | -- | None Available |
Source: Public Records
Mortgage History
| Date | Status | Borrower | Loan Amount |
|---|---|---|---|
| Previous Owner | Oukrust Jimmy | $160,000 | |
| Previous Owner | Oukrust Jimmy | $162,761 |
Source: Public Records
Tax History Compared to Growth
Tax History
| Year | Tax Paid | Tax Assessment Tax Assessment Total Assessment is a certain percentage of the fair market value that is determined by local assessors to be the total taxable value of land and additions on the property. | Land | Improvement |
|---|---|---|---|---|
| 2024 | $7,811 | $99,049 | $32,903 | $66,146 |
| 2023 | $7,379 | $90,580 | $30,090 | $60,490 |
| 2022 | $7,630 | $88,710 | $29,890 | $58,820 |
| 2021 | $7,273 | $84,290 | $28,400 | $55,890 |
| 2020 | $7,152 | $82,240 | $27,710 | $54,530 |
| 2019 | $6,876 | $79,030 | $26,630 | $52,400 |
| 2018 | $6,153 | $72,230 | $25,930 | $46,300 |
| 2017 | $5,807 | $66,940 | $24,030 | $42,910 |
| 2016 | $5,489 | $61,950 | $22,240 | $39,710 |
| 2015 | $5,354 | $57,810 | $20,750 | $37,060 |
| 2014 | $5,319 | $56,530 | $20,290 | $36,240 |
| 2013 | $5,353 | $58,460 | $20,980 | $37,480 |
Source: Public Records
Map
Nearby Homes
- 852 Napa St
- 975 Merbach Ct
- 911 Hampton Dr
- 312 Dancing Water Ct
- 1065 Brighton Dr
- 351 Juniper Ct
- 720 Hoover Dr Unit 124
- 969 Dearborn Cir
- 607 Kingsbridge Dr
- 787 Daybreak Ln Unit 207
- 808 Trinity Ct
- 641 Kingsbridge Dr
- 1119 Orangery Ct
- 1090 Maubert Ct
- 129 W Elk Trail Unit 329
- 125 W Elk Trail Unit 124
- 107 W Elk Trail Unit 106
- 244 Klein Creek Ct Unit 3
- 342 Klein Creek Ct Unit 342A
- 654 Tacoma Dr
- 980 Tioga Ct
- 513 Canyon Trail
- 521 Canyon Trail
- 986 Tioga Ct
- 499 Canyon Trail
- 975 Tioga Ct
- 983 Tioga Ct
- 1033 Kuhn Rd Unit 2
- 1033 Kuhn Rd Unit 3
- 1033 Kuhn Rd Unit 6
- 525 Canyon Trail
- 992 Tioga Ct
- 510 Canyon Trail
- 955 Wampum Ct
- 493 Canyon Trail
- 998 Tioga Ct Unit 6
- 500 Canyon Trail
- 490 Aleut Trail
- 995 Tioga Ct
- 527 Canyon Trail