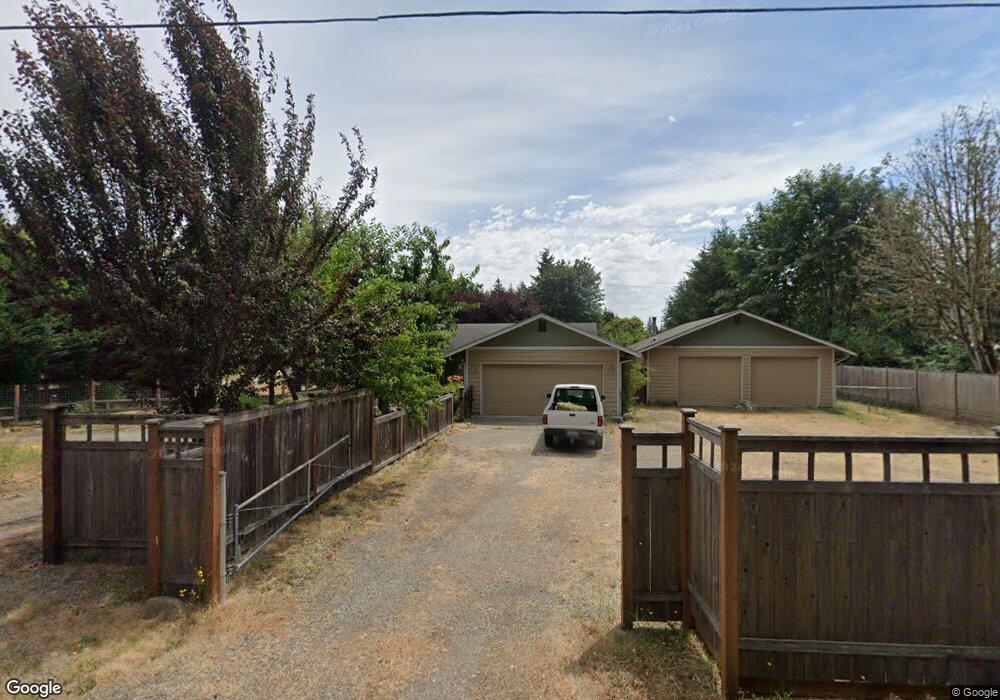
974 Tipsoo Loop S Rainier, WA 98576
Estimated Value: $455,582 - $495,000
3
Beds
1
Bath
1,125
Sq Ft
$428/Sq Ft
Est. Value
About This Home
This home is located at 974 Tipsoo Loop S, Rainier, WA 98576 and is currently estimated at $481,396, approximately $427 per square foot. 974 Tipsoo Loop S is a home located in Thurston County with nearby schools including Rainier Elementary School, Rainier Middle School, and Rainier Senior High School.
Ownership History
Date
Name
Owned For
Owner Type
Purchase Details
Closed on
Aug 3, 2021
Sold by
Ward Trevor J
Bought by
Locke Patrick P and Locke Linda J
Current Estimated Value
Purchase Details
Closed on
Jun 27, 2006
Sold by
Cram Frank Gene and Cram Sonja Choi
Bought by
Ward Trevor J
Home Financials for this Owner
Home Financials are based on the most recent Mortgage that was taken out on this home.
Original Mortgage
$200,000
Interest Rate
6.62%
Mortgage Type
Purchase Money Mortgage
Purchase Details
Closed on
Mar 12, 1997
Sold by
Mc Investments
Bought by
Cram Frank Gene and Cram Sonja Choi
Home Financials for this Owner
Home Financials are based on the most recent Mortgage that was taken out on this home.
Original Mortgage
$19,000
Interest Rate
10%
Purchase Details
Closed on
Mar 14, 1996
Sold by
Berry Tommy G and Berry Patricia A
Bought by
M C Investments
Create a Home Valuation Report for This Property
The Home Valuation Report is an in-depth analysis detailing your home's value as well as a comparison with similar homes in the area
Home Values in the Area
Average Home Value in this Area
Purchase History
| Date | Buyer | Sale Price | Title Company |
|---|---|---|---|
| Locke Patrick P | $379,687 | Chicago Title | |
| Ward Trevor J | $214,887 | First American Title | |
| Cram Frank Gene | -- | First American Title Ins Co | |
| Cram Frank Gene | $24,000 | First American Title Ins Co | |
| M C Investments | -- | Transamerica Title Ins Compa |
Source: Public Records
Mortgage History
| Date | Status | Borrower | Loan Amount |
|---|---|---|---|
| Previous Owner | Ward Trevor J | $200,000 | |
| Previous Owner | Cram Frank Gene | $19,000 |
Source: Public Records
Tax History
| Year | Tax Paid | Tax Assessment Tax Assessment Total Assessment is a certain percentage of the fair market value that is determined by local assessors to be the total taxable value of land and additions on the property. | Land | Improvement |
|---|---|---|---|---|
| 2025 | $945 | $452,400 | $130,500 | $321,900 |
| 2024 | $945 | $428,400 | $129,200 | $299,200 |
| 2023 | $945 | $438,700 | $121,000 | $317,700 |
| 2022 | $3,930 | $423,400 | $85,000 | $338,400 |
| 2021 | $3,196 | $380,900 | $98,100 | $282,800 |
| 2020 | $2,953 | $304,600 | $79,400 | $225,200 |
| 2019 | $2,626 | $255,000 | $52,400 | $202,600 |
| 2018 | $2,881 | $228,000 | $45,500 | $182,500 |
| 2017 | $2,649 | $217,000 | $37,800 | $179,200 |
| 2016 | $2,645 | $204,900 | $47,800 | $157,100 |
| 2014 | -- | $199,600 | $47,800 | $151,800 |
Source: Public Records
Map
Nearby Homes
- 733 Tipsoo Loop S
- 955 Tipsoo Loop N
- 101 Murphy Ln S
- 605 Hubbard Rd SE
- 309 Binghampton St SE
- 414 Easy St SE
- 302 Centre St N
- 823 Tipsoo Loop S
- 308 Easy St SE
- 108 2nd St SE
- 108 Centre St S
- 701 Myers St SE
- 810 Cody St SE
- 604 Nieland Loop SE
- 132 xx Algyer Rd SE
- 210 Country Estates Dr W
- 14319 123rd Ave SE
- 14532 130th Ln SE
- 11635 Hobby St SE
- 14913 Champion Estates Dr SE
- 974 Tipsoo Loop N
- 976 Tipsoo Loop N Unit B
- 976 Tipsoo Loop N Unit A
- 972 Tipsoo Loop N
- 720 Tipsoo Loop S
- 718 Tipsoo Loop S
- 970 Tipsoo Loop N
- 978 Tipsoo Loop N
- 973 Tipsoo Loop N
- 975 Tipsoo Loop N
- 721 Tipsoo Loop N
- 977 Tipsoo Loop N
- 716A Tipsoo Loop S
- 971 Tipsoo Lp N
- 971 Tipsoo Loop N
- 980 Tipsoo Loop N
- 723 Tipsoo Loop S
- 723 Tipsoo Loop S
- 728 Tipsoo Loop S
- 714 Tipsoo Loop S
Your Personal Tour Guide
Ask me questions while you tour the home.